


Bitcoin falls on hot CPI: Why $80,000 support matters
- Bitcoin dropped below $82,000 after a hot US CPI print for September.
- The decline placed BTC near $80,000, which holds the largest block of buy orders on Binance's spot order book.
- Long-term holders' realized losses have fallen, but break-even investors and ETF selling limits demand.
Bitcoin's (BTC) most critical level to watch is near $80,000 as September's hot inflation reading pressures the crypto market, according to Glassnode.
Bitcoin drops as US inflation exceeds forecasts
The top crypto declined within minutes of the September Consumer Price Index (CPI) release, which showed a 3.7% annual increase in headline inflation, above forecasts of 3.6%. Core inflation, which excludes food and energy prices, came in at 2.6%.
Bitcoin now faces risks on both sides of its current price, with $80,000 emerging as a critical support level and $88,000 representing a major resistance area, according to a Wednesday report from Glassnode.
Two large groups of Bitcoin holders sit above the current market price, creating potential resistance as the cryptocurrency attempts to recover.
Glassnode said BTC acquired six to 12 months ago has an average cost basis of roughly $88,000, while those purchased one to two years ago have a cost basis near $100,000.
Both groups have previously sold into rallies. Bitcoin reached the first group's cost basis in January before falling by more than a third. In May, it hit the second group's cost basis and then fell by about 25%.
“Until Bitcoin closes above $88K, each push higher meets holders who can sell near their break-even,” Glassnode analysts wrote.
On the downside, Bitcoin's immediate support is concentrated between $80,000 and $81,500. The analysts highlighted that the largest block of buy orders on Binance's spot order book has shifted from $81,000 to $80,000.
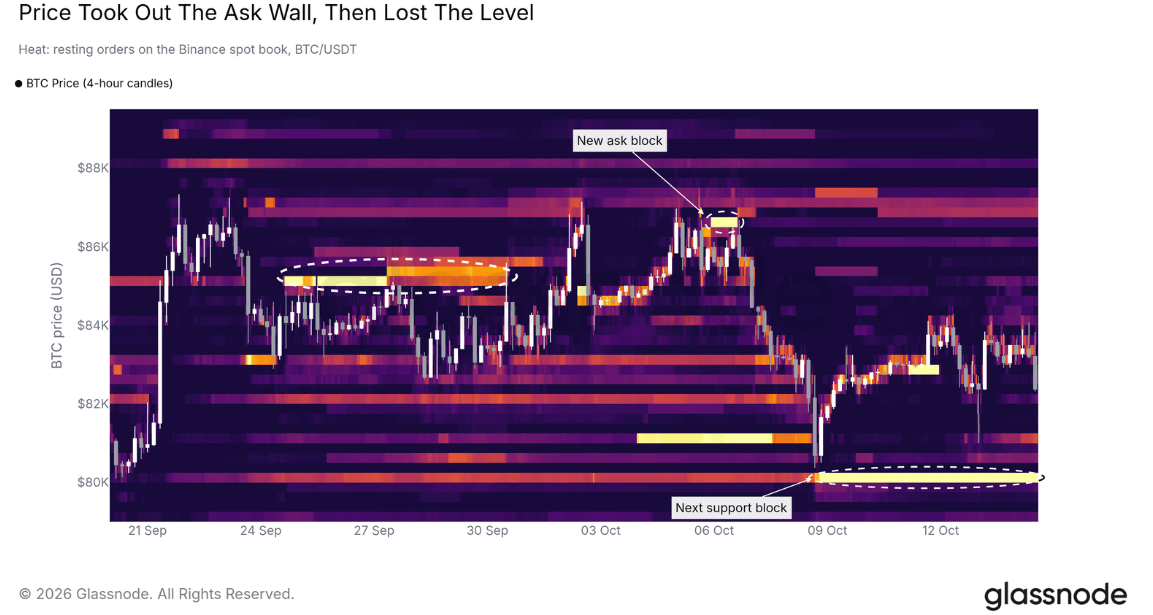
The $80,000 level sits just below the US spot Bitcoin ETF cost basis of roughly $81,500, representing the average acquisition price of Bitcoin held by these funds.
“A break below it would bring the liquidation cluster just under $80K, and then the True Market Mean near $78K, into play,” the report stated.
Bitcoin's recovery faces hurdles despite declining realized losses
Despite the recent decline, several onchain metrics suggest the market has retained some underlying strength.
Glassnode reported that long-term holders have largely stopped selling Bitcoin at a loss. Their realized losses peaked on August 12 and have since fallen by approximately 85%. The report highlights that realized losses peaked within weeks of the cycle low during the 2022 bear market.
Bitcoin also continues to trade above the True Market Mean and the Short-Term Holder Cost Basis. It has remained above both levels since September 18, a period Glassnode identifies as a bullish regime.
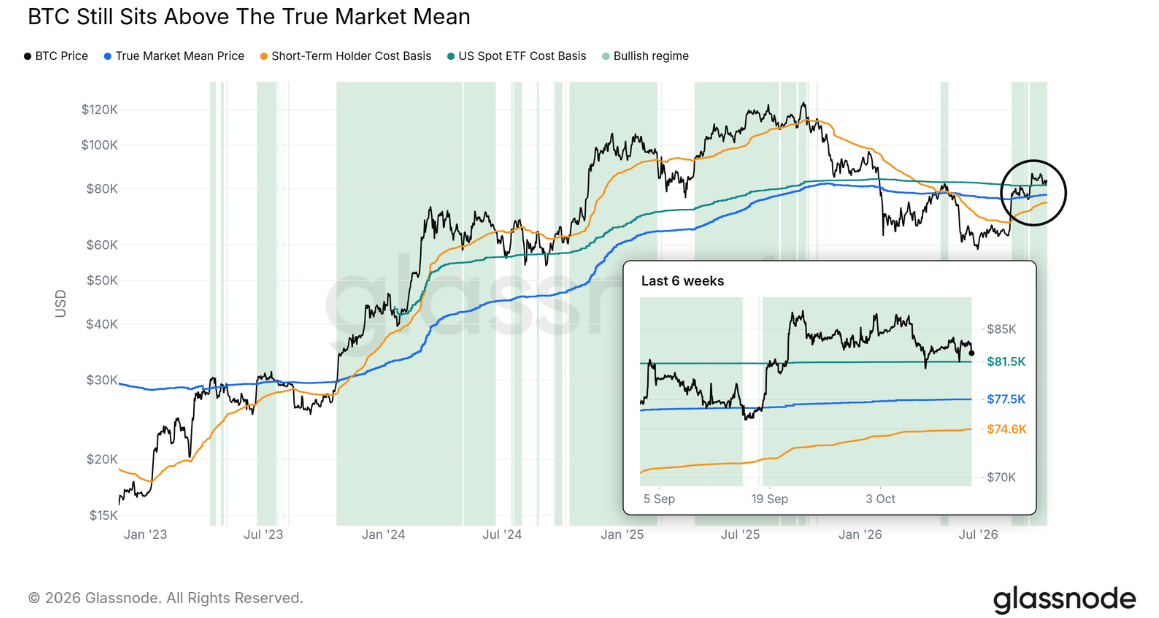
However, Bitcoin's position relative to the US spot ETF cost basis remains important. The top crypto briefly fell below the $81,500 level on October 8 and October 13, although it closed above it both times.
“A daily close below it would put the average ETF holder back at a loss and remove the nearest on-chain support,” the report stated.
Institutional demand has weakened after a strong buying period in late September. US spot Bitcoin ETFs attracted nearly $3 billion between September 21 and October 6, marking their fastest pace of inflows since November 2025. However, the funds have recorded approximately $760 million in net outflows since October 7.
Glassnode warned that ETF selling, combined with pressure from holders near their break-even prices, leaves limited fresh demand to support Bitcoin.
“A return to steady ETF inflows would be the clearest sign that demand is back,” the firm stated.
Bitcoin is trading at $81,707, down 1.6% in the past 24 hours at the time of writing.
추천 기사


