


Crypto Today: Bitcoin, Ethereum, XRP tick down despite a broader bullish crypto market outlook
- Bitcoin remains pressured near $78,000 support, but still holds above major uptrending moving averages.
- Ethereum struggles below $2,500 resistance, aligning with downtrending momentum indicators.
- XRP approaches the 200-day EMA short-term support as the path of least resistance gradually shifts downward.
Bitcoin (BTC) remains in a short-term corrective trend, edging lower toward $78,000 on Tuesday. The largest cryptocurrency by market capitalization broadly corrected following last week’s breakout toward $81,500.
Holding at a higher support could boost BTC’s outlook as investor attention shifts toward the release of the United States (US) Consumer Price Index (CPI) report on Friday and the upcoming Federal Reserve (Fed) decision on interest rates.
Meanwhile, Ethereum (ETH) hovers below $2,500 while maintaining a broader bullish outlook. To renew the uptrend, bulls need to reclaim the short-term $2,500 hurdle, as continued trading below the same level could prompt selling among investors seeking to lock in profits.
Ripple (XRP) is similarly struggling to renew the uptrend despite holding above key moving-average support levels. The remittance token is trading at $1.38 amid capped upside and needs to flip supply at $1.40 into support to keep the bullish picture intact.
Technical analysis: Bitcoin falls within a constructive bullish outlook
Bitcoin trades at $78,393, marking two days of sustained losses after the rejection from highs near $81,500 last week. Despite the correction, the pair preserves a constructive bullish bias as price holds well above the major Exponential Moving Averages (EMAs), with the 50-day EMA at $72,309, the 100-day EMA at $70,421 and the 200-day EMA at $72,827 all trailing below spot and reinforcing the broader uptrend.
Momentum is mixed, with the Relative Strength Index (RSI) easing to around 60 from recent overbought extremes while the Moving Average Convergence Divergence (MACD) remains in negative territory, hinting that upside may advance more cautiously despite the supportive trend structure.
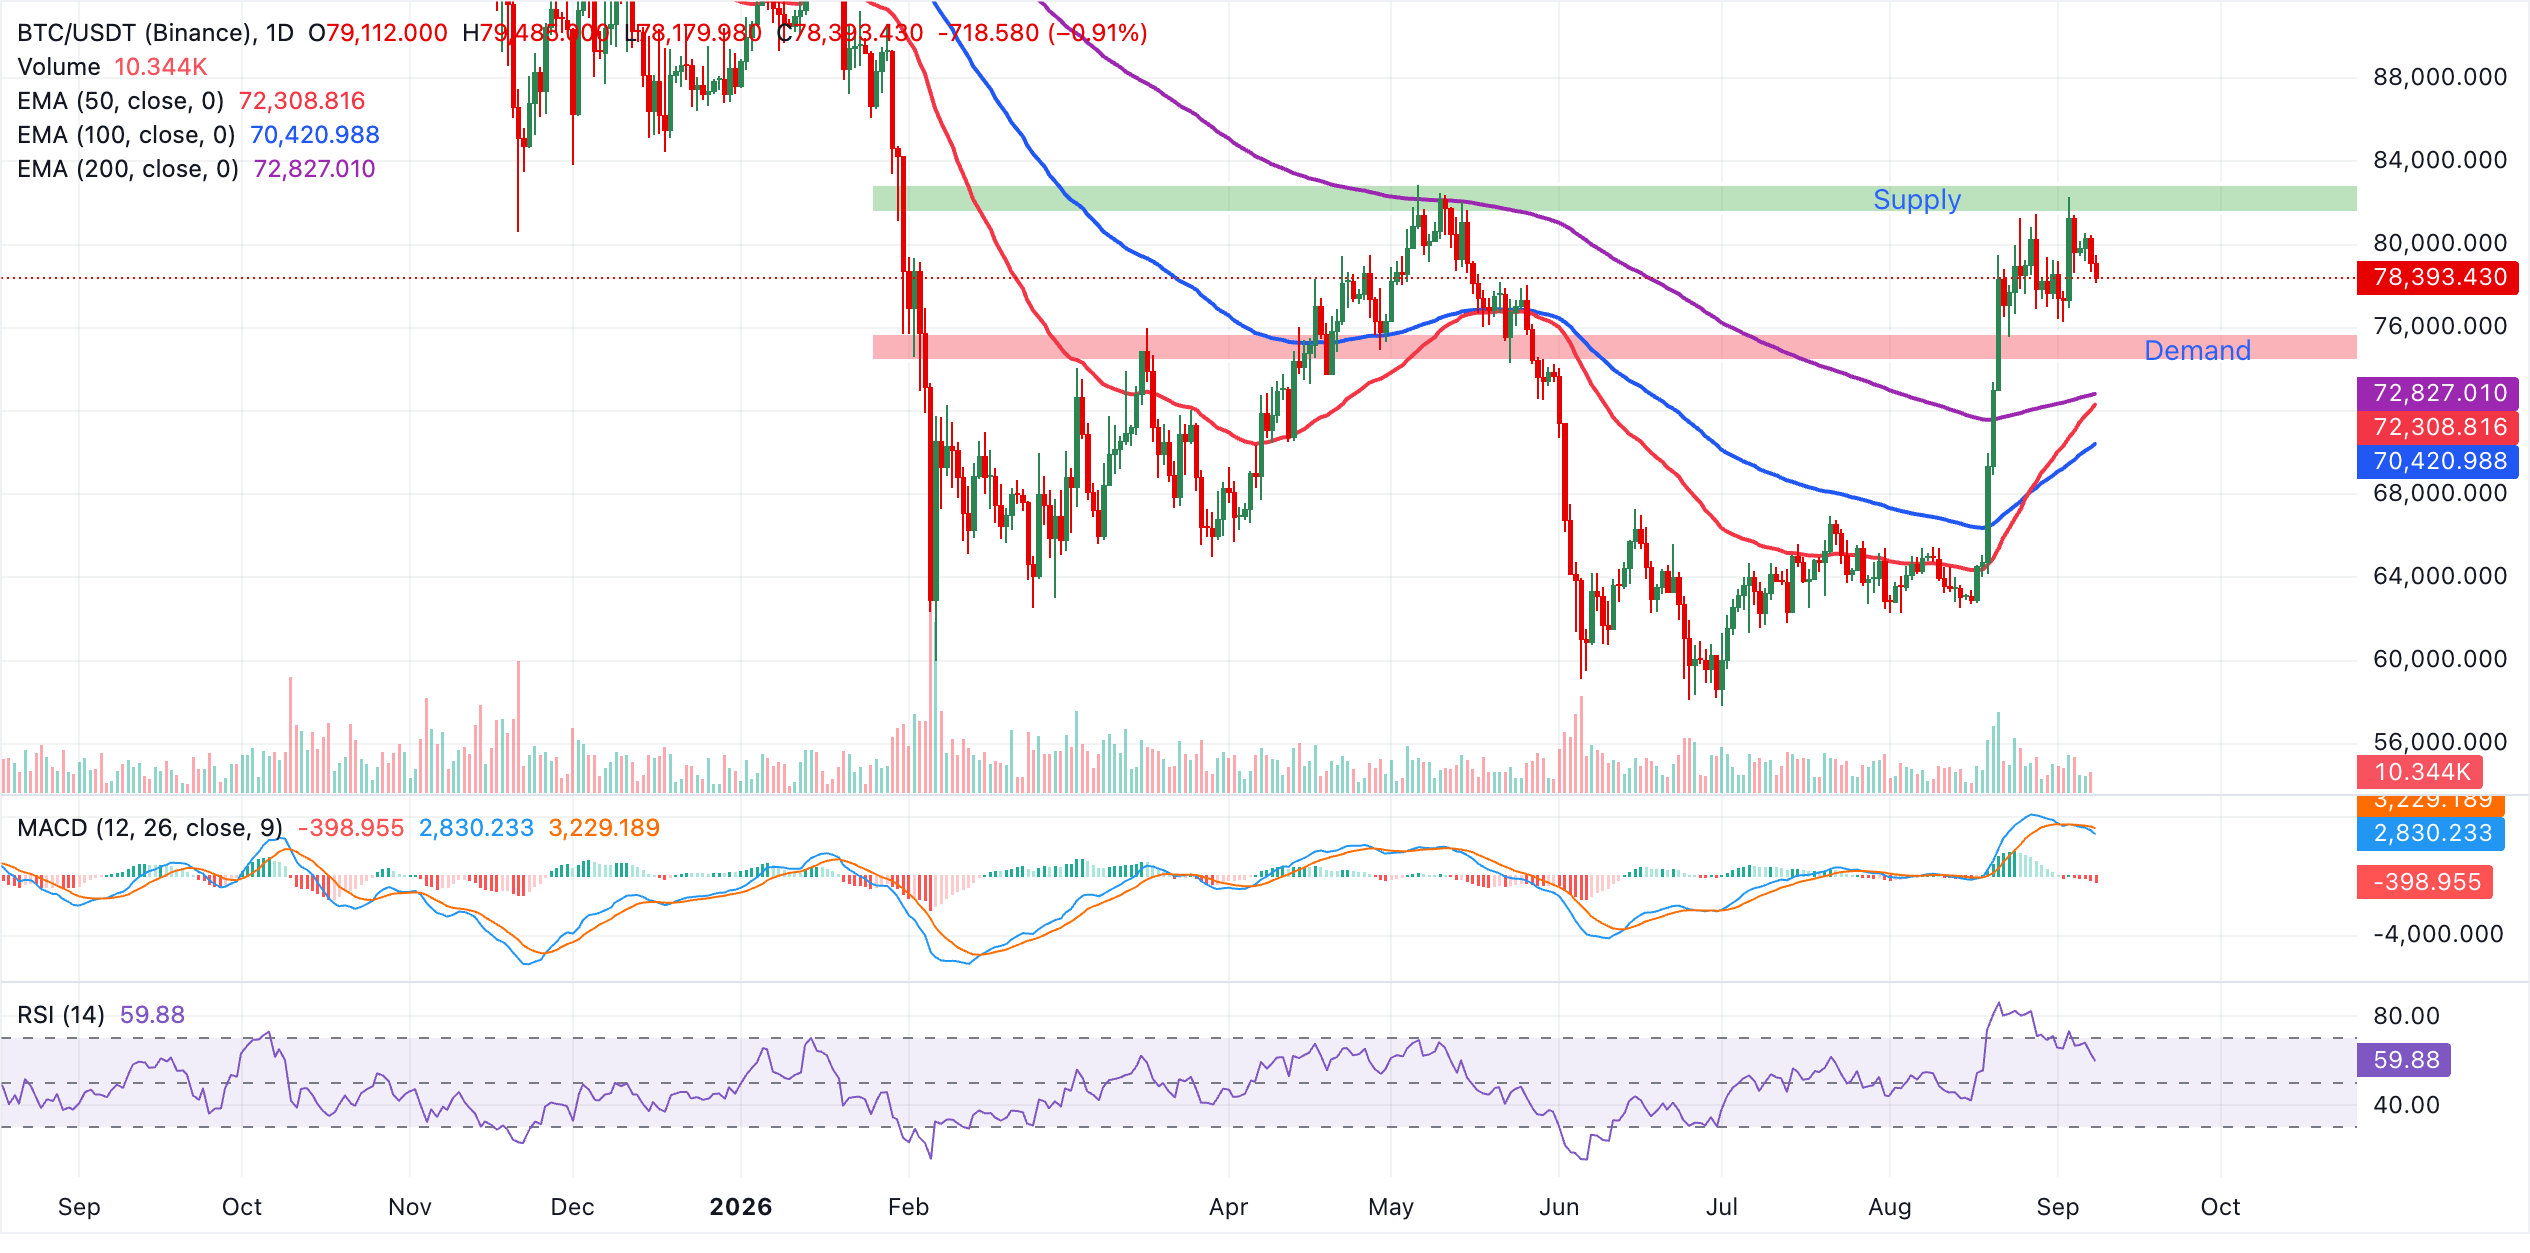
On the downside, immediate support is now aligned with the 200-day EMA at $72,827, closely backed by the 50-day EMA at $72,309, forming a dense demand area that would need to give way to signal a deeper correction towards the 100-day EMA near $70,421. As long as BTC holds above these clustered EMAs, dips are likely to be bought, and only a sustained break below the 100-day EMA would materially weaken the current bullish technical outlook.
"Bitcoin pressing $79,500 into September, a full two weeks after its 23% breakout, is the quiet confirmation the bulls needed. The textbook outcome after a near-vertical move is a sharp giveback," Yusuf Fakhro, Partner at ARP Digital, told FXStreet in a written comment, adding, "instead, Bitcoin has spent a fortnight consolidating in a tight band, defending the $77,000 floor that has held since the breakout and now probing the upper end of the range rather than the lower. A market that digests a violent move rather than reversing it is a market that has genuinely repriced."
Altcoins technical analysis: Ethereum and XRP struggle as headwinds persist
Ethereum trades at $2,471 as selling takes root following last week's recovery. Still, the smart contract token holds a constructive bullish bias as price extends comfortably above the 50-day, 100-day and 200-day EMAs clustered between roughly $2,100 and $2,200. This setup suggests the broader uptrend remains intact despite a recent loss of upside momentum, with the RSI easing from overbought territory but still holding above 61, while the MACD has slipped below the zero line, hinting at a corrective phase within an overall supportive structure.
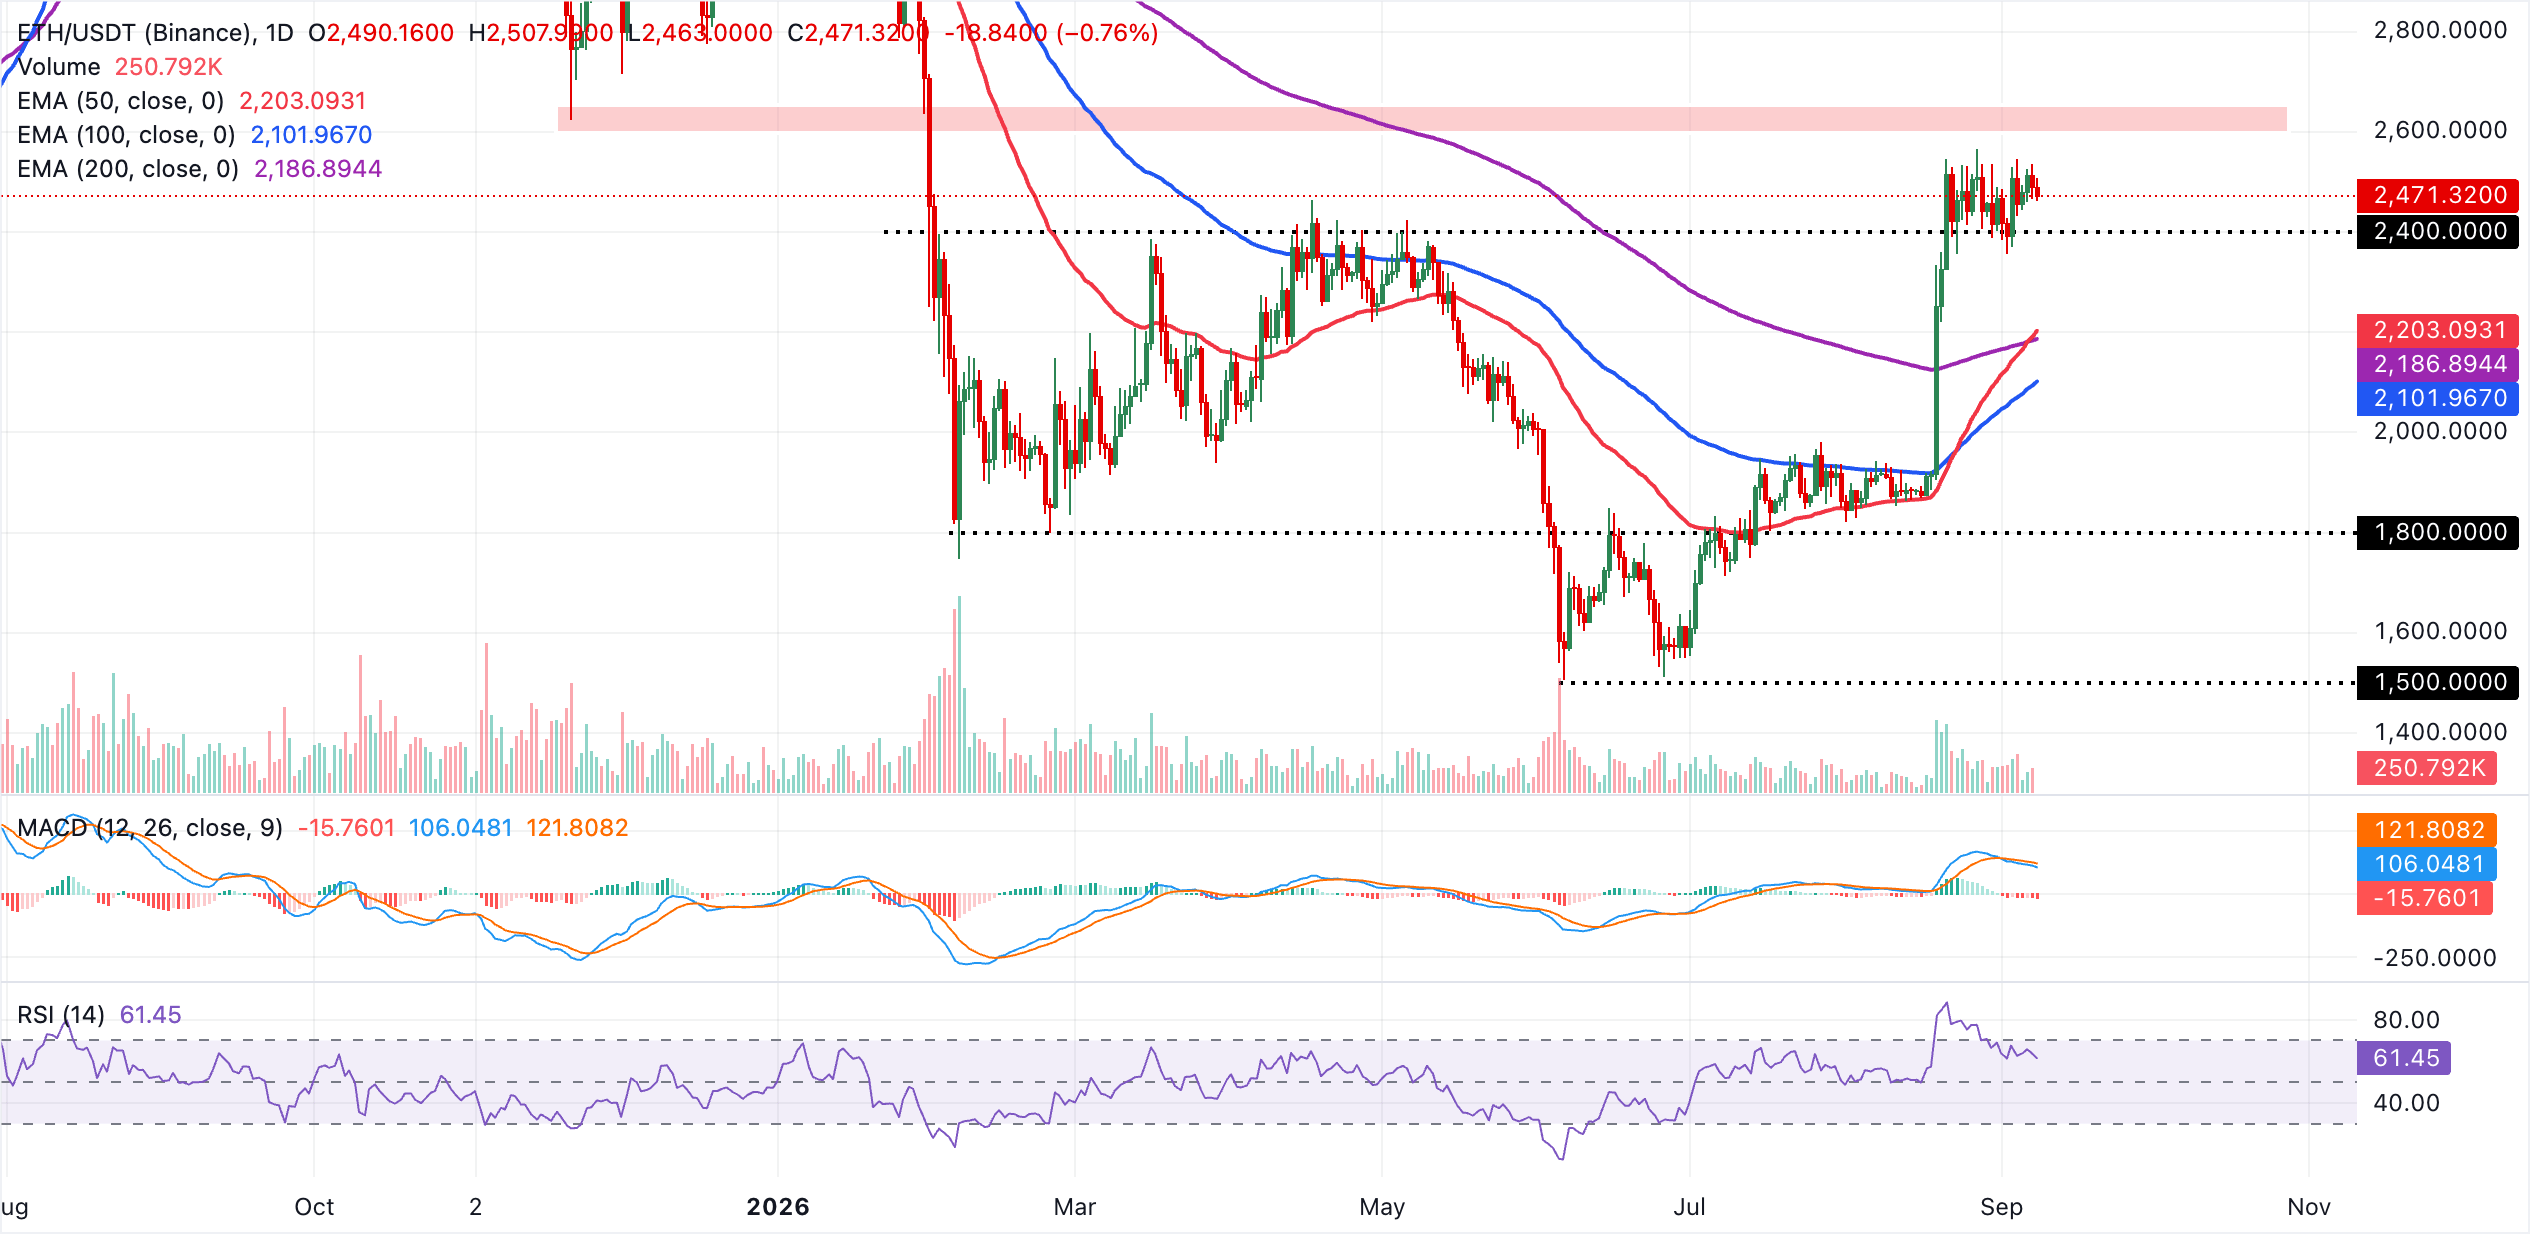
Initial support lies around the 50-day EMA at approximately $2,203, reinforced by the nearby 200-day EMA at about $2,187 and the 100-day EMA near $2,102, where buyers would be expected to re-emerge on deeper pullbacks. As long as ETH holds above this EMA cluster, the prevailing uptrend is likely to stay in place, with any consolidation above these levels keeping the door open for another attempt at the recent highs once momentum indicators stabilize.
As for XRP, the price has marked the second straight day of declines, trading at $1.38. The pair holds above the 50-day, 100-day and 200-day EMAs, with the long-term 200-day EMA now offering a bullish floor around $1.36, suggesting the broader uptrend remains intact despite recent consolidation.
The spot price, however, still trades below the downward resistance trendline near $1.42, keeping immediate upside capped even as the RSI eases back from overbought territory and the MACD slips marginally below zero, hinting at a moderating, rather than reversed, bullish tone.
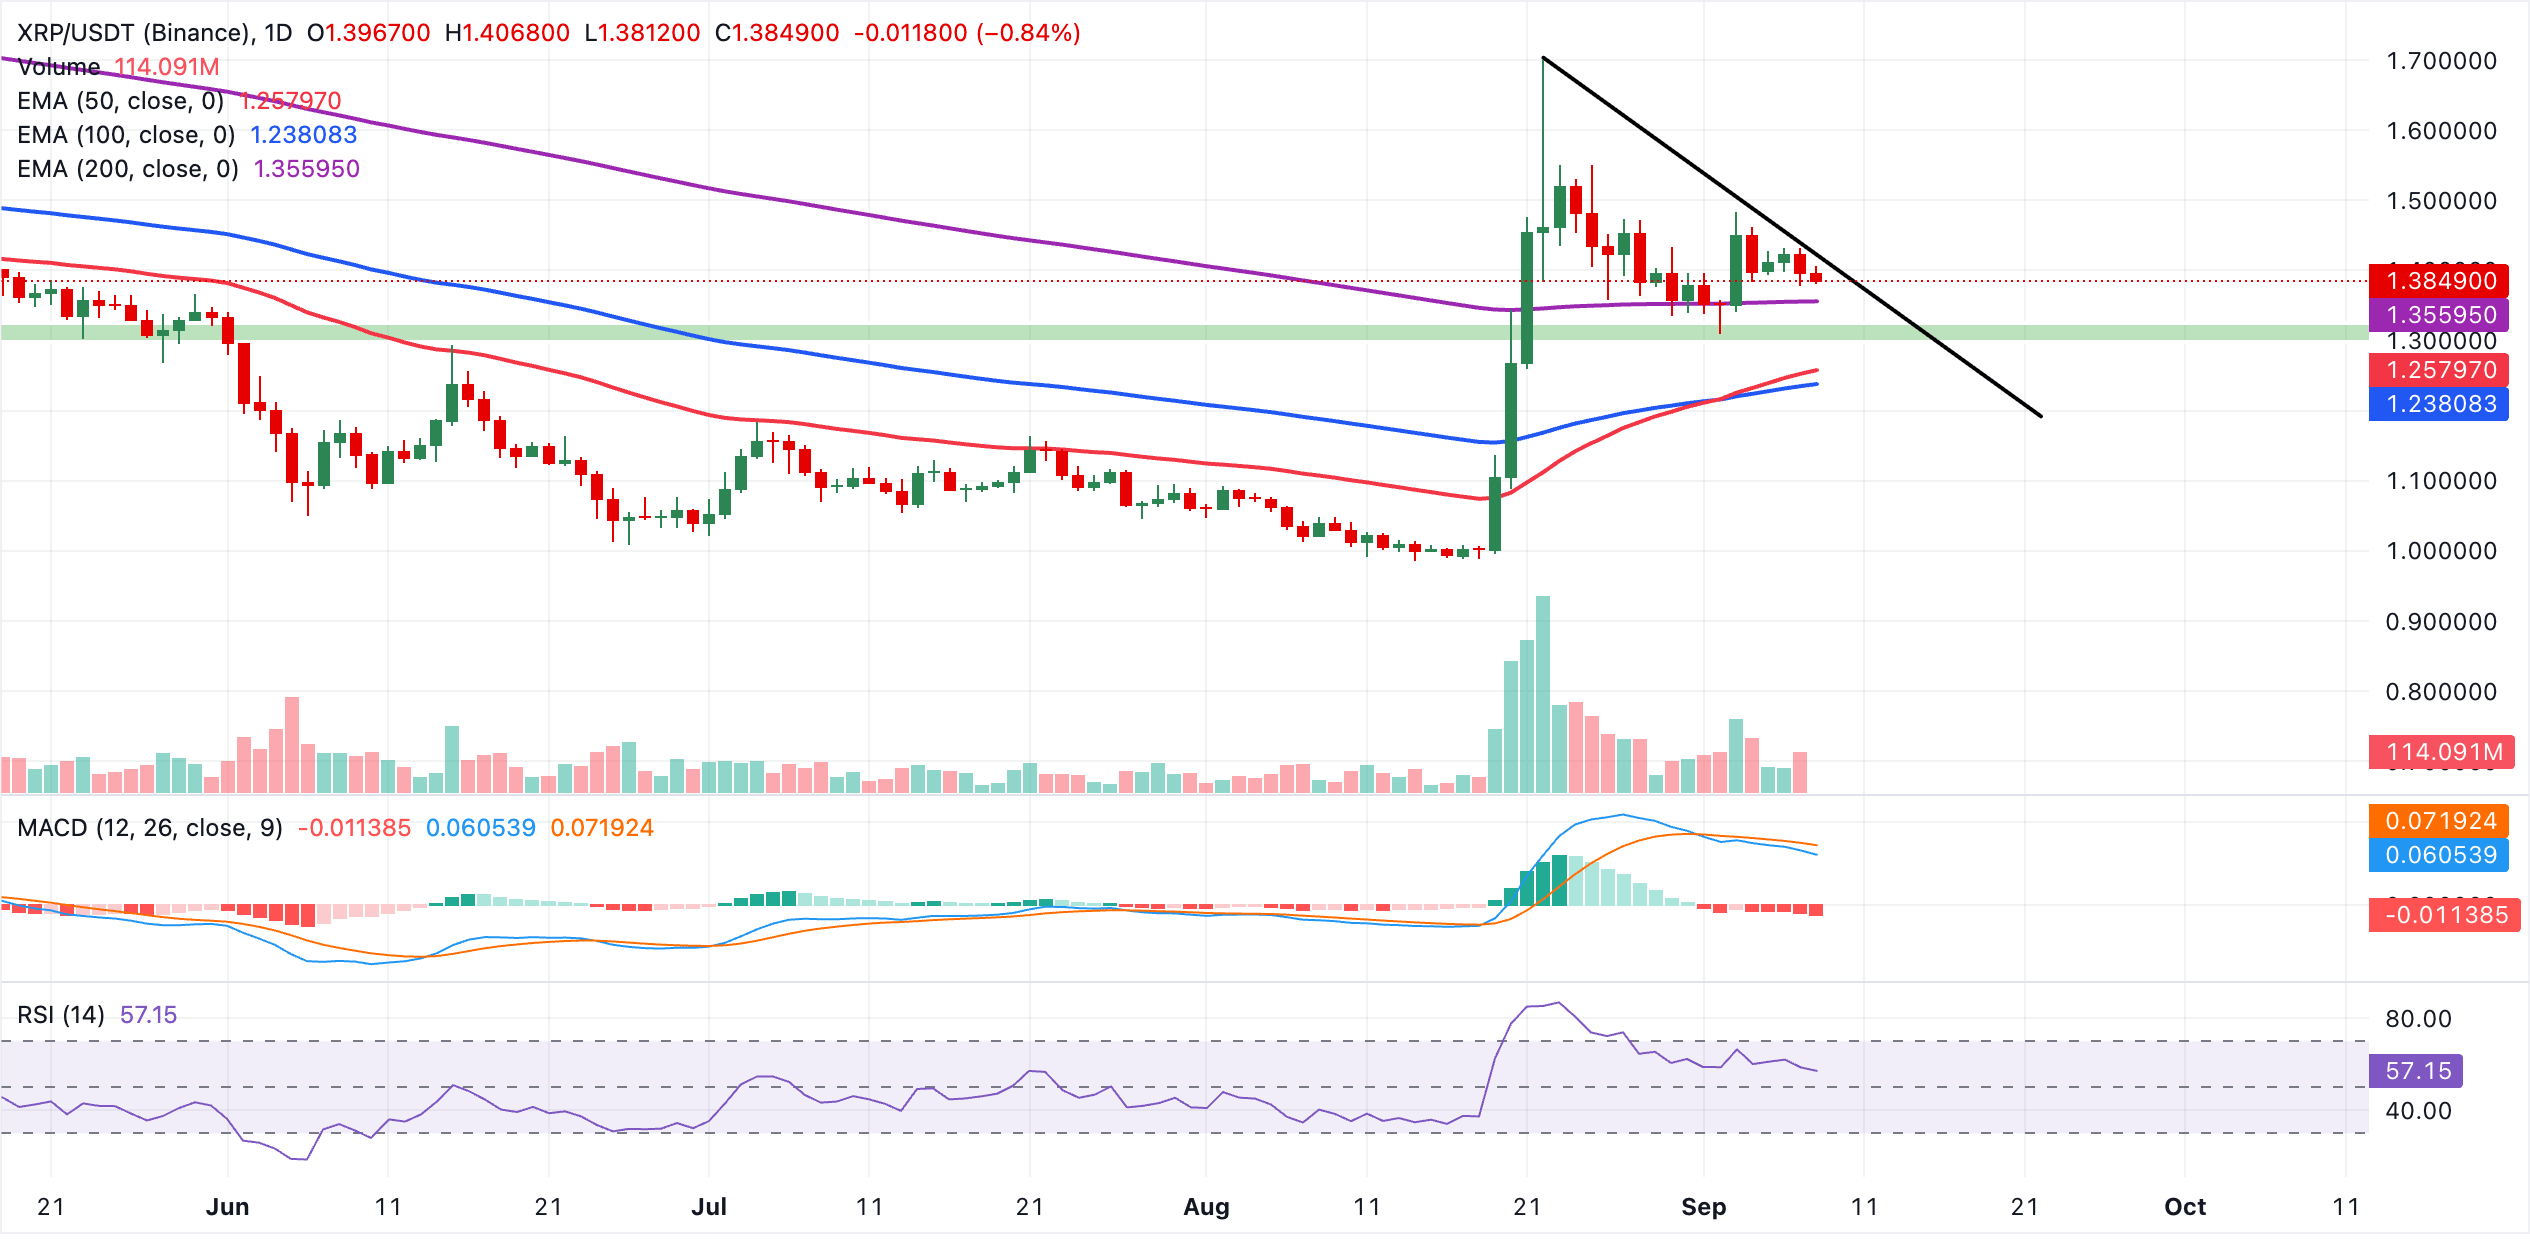
On the topside, initial resistance lies along the downward trendline around $1.42. A daily close above this barrier would open the way to a retest of recent highs near $1.50 and $1.70, respectively. On the downside, immediate support lies at the 200-day EMA near $1.36, with deeper demand expected around the clustered 50-day and 100-day EMAs between roughly $1.26 and $1.24, where buyers are likely to defend the broader bullish structure if a corrective pullback develops.
(The technical analysis of this story was written with the help of an AI tool. Know more.)
Bitcoin, altcoins, stablecoins FAQs
Bitcoin is the largest cryptocurrency by market capitalization, a virtual currency designed to serve as money. This form of payment cannot be controlled by any one person, group, or entity, which eliminates the need for third-party participation during financial transactions.
Altcoins are any cryptocurrency apart from Bitcoin, but some also regard Ethereum as a non-altcoin because it is from these two cryptocurrencies that forking happens. If this is true, then Litecoin is the first altcoin, forked from the Bitcoin protocol and, therefore, an “improved” version of it.
Stablecoins are cryptocurrencies designed to have a stable price, with their value backed by a reserve of the asset it represents. To achieve this, the value of any one stablecoin is pegged to a commodity or financial instrument, such as the US Dollar (USD), with its supply regulated by an algorithm or demand. The main goal of stablecoins is to provide an on/off-ramp for investors willing to trade and invest in cryptocurrencies. Stablecoins also allow investors to store value since cryptocurrencies, in general, are subject to volatility.
Bitcoin dominance is the ratio of Bitcoin's market capitalization to the total market capitalization of all cryptocurrencies combined. It provides a clear picture of Bitcoin’s interest among investors. A high BTC dominance typically happens before and during a bull run, in which investors resort to investing in relatively stable and high market capitalization cryptocurrency like Bitcoin. A drop in BTC dominance usually means that investors are moving their capital and/or profits to altcoins in a quest for higher returns, which usually triggers an explosion of altcoin rallies.
추천 기사


