

Solana Price Forecast: SOL risks further decline amid weak institutional, retail demand

출처 Fxstreet
  • Solana edges lower on Monday as an overhead trendline caps two previous days of recovery.
  • SOL ETFs recorded two consecutive weekly inflows of less than $1 million, indicating weak institutional demand.
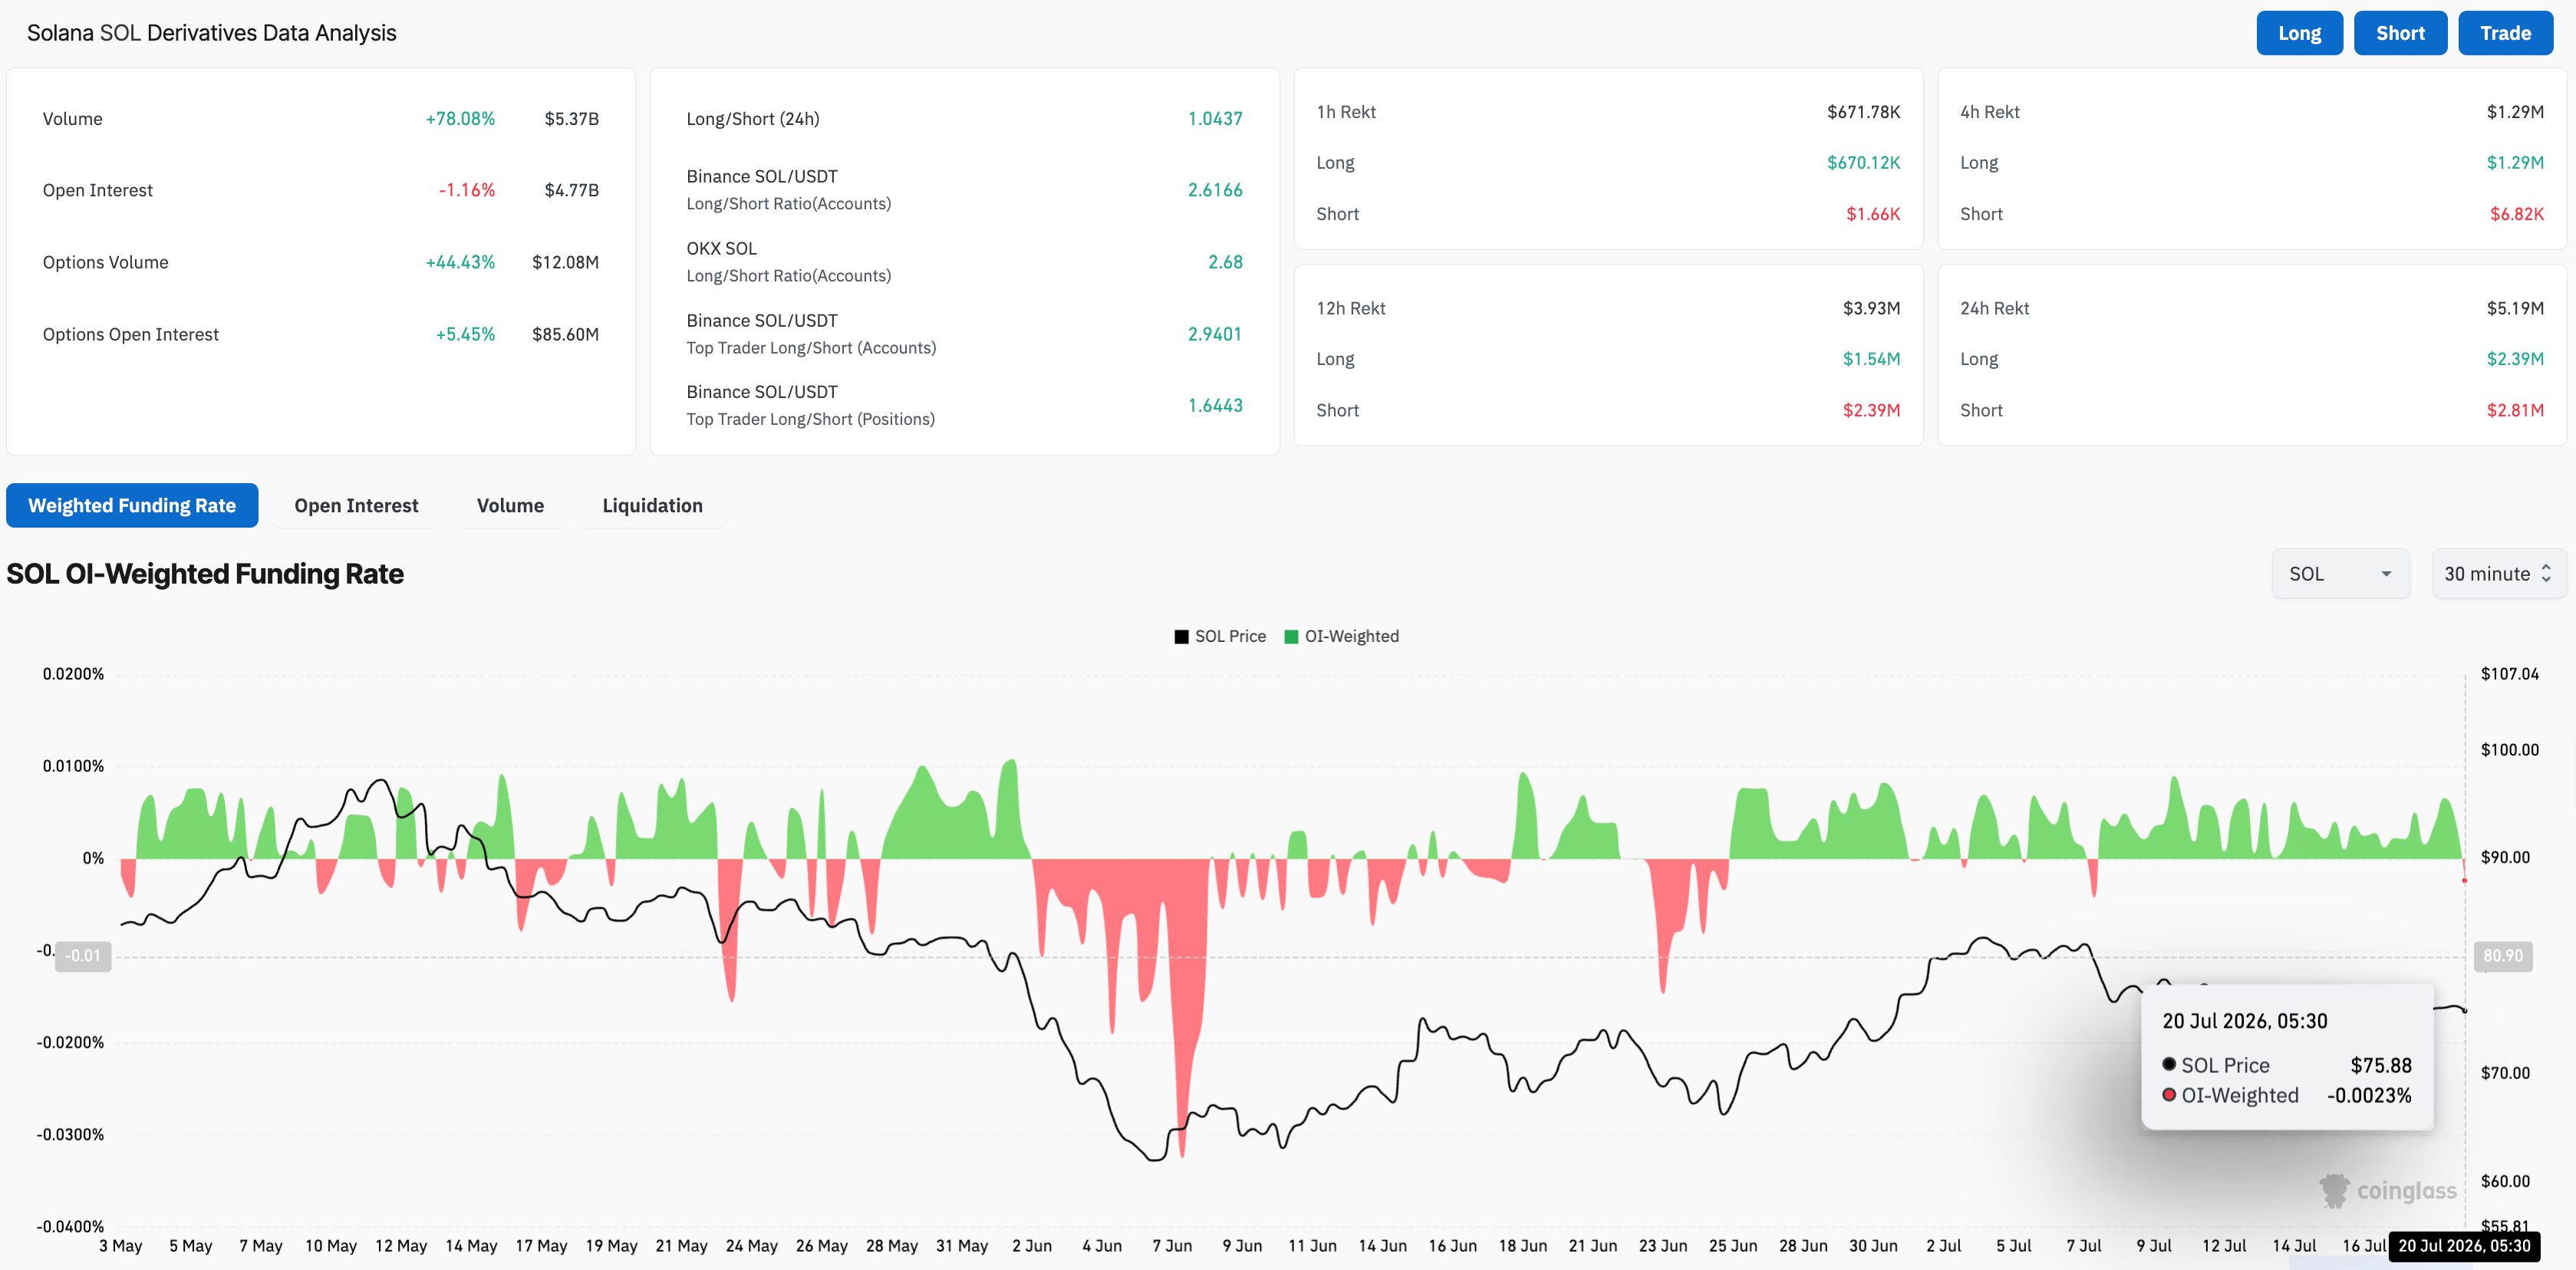
  • Declining Open Interest and funding rate imply a bearish retail bias, despite trading volume being up over 70% in 24 hours.

Solana (SOL) price edges lower on Monday, maintaining a corrective tone from early July. Institutional demand remains muted, with two consecutive weeks of inflows under $1 million, while declining Open Interest and the funding rate point to bearish retail interest, even as trading volume rises by over 70% in 24 hours. 

Institutional, retail signal further downside for Solana

Solana struggles to regain strength despite easing broader market risk-off sentiment. CoinGlass data show a minor contraction in SOL futures Open Interest (OI) over the last 24 hours, to $4.77 billion, despite a 78% increase in trading volume to $5.37 billion. Meanwhile, the funding rate has slipped below zero to 0.0023%, indicating that traders are willing to buy short positions at a premium. 

On the institutional side, the SOL-focused Exchange Traded Funds (ETFs) recorded $948,210 in inflows last week, following the previous week’s inflow of $930,430. This points to institutional interest shifting from SOL to other blue-chip crypto assets like Bitcoin (BTC) and Ethereum (ETH), with inflows of $75.67 million and $105.44 million last week.
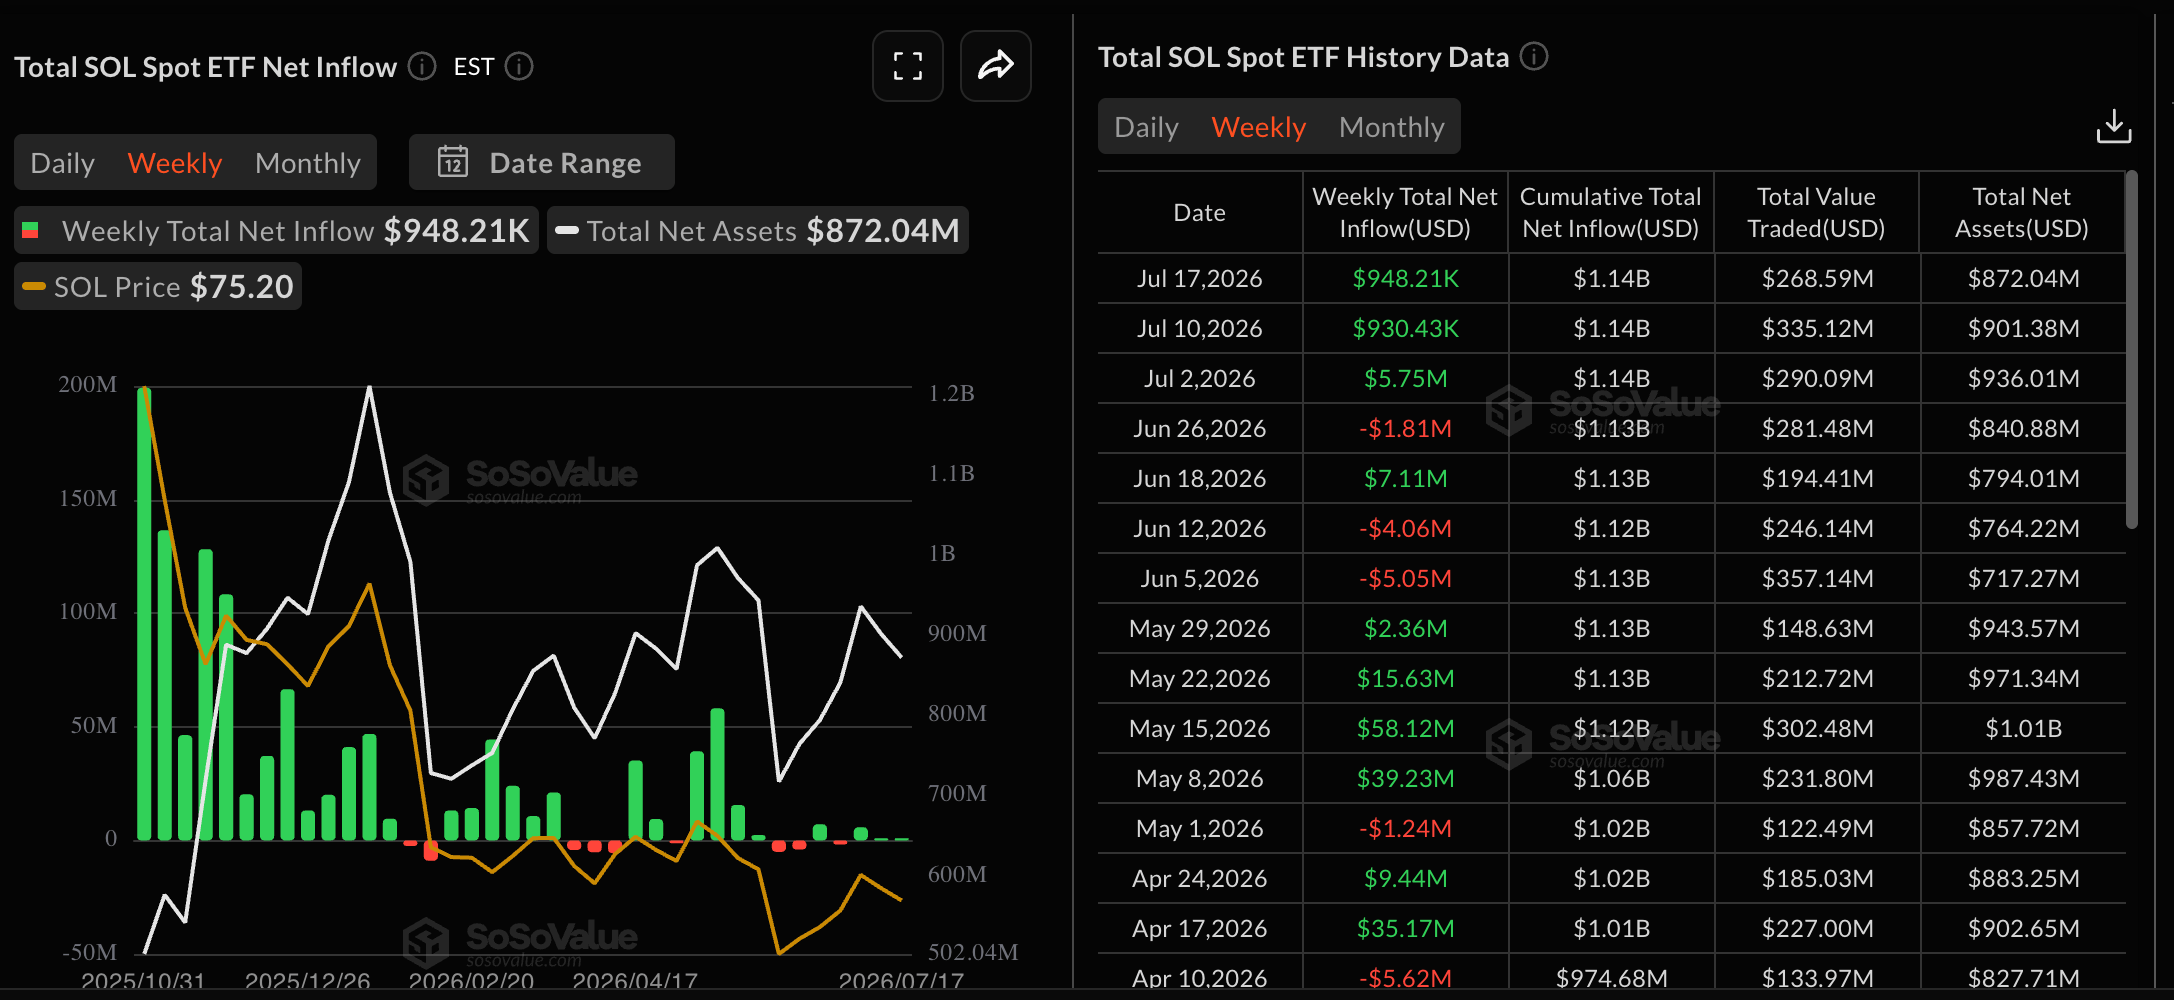
SOL ETFs data. Source: Sosovalue
SOL derivatives data. Source: CoinGlass

Will Solana price test $70?

Solana holds a mildly bearish near-term bias as price remains below a local resistance trendline on the 4-hour chart. At the time of writing, SOL trades in the red on Monday, under its 50-period Exponential Moving Average (EMA) at $76.32 and the 200-period EMA at $76.51.

The Relative Strength Index (RSI) around 49 on the 4-hour chart signals neutral momentum, while the Moving Average Convergence Divergence (MACD) and signal line hint at modest positive pressure that has yet to overcome structural resistance.

Looking down, the immediate support lies at the S1 Pivot level near $73.50, reinforced by a descending support trendline near $72.80. A slip below this zone could target the S2 Pivot level at $70.62.

Chart Analysis SOL/USDT (Binance)
SOL/USDT 4-hour price chart.

On the topside, a decisive close above the downward resistance trendline near $77.27 could confirm further upside for SOL. The R1 and R2 Pivot levels at $79.15 and $81.92 could cap the potential breakout rally.

(The technical analysis of this story was written with the help of an AI tool. Know more.)

면책 조항: 정보 제공 목적으로만 사용됩니다. 과거 성과가 미래 결과를 보장하지 않습니다.
placeholder
Bitcoin(BTCUSD) 종목이 7월14일에 1.03% 상승했습니다. 위험 요인은 무엇인가요?Bitcoin (BTCUSD) 종목은 7월14일 01:10(ET)에 1.03% 상승하여, 현재 가격은 $62821.21이고, 최근 7일간 1.33% 하락했습니다.오늘 Bitcoin(BTCUSD) 주가 상승의 요인은 무엇인가요?글로벌 매크로 환경이 더 우호적인 유동성 여건으로 전환되면서 비트코인이 강세를 보이고 있다. 최근 인플레이션 압력의 안정화는 연방준비
저자  Mitrade팀
7 월 14 일 화요일
Bitcoin (BTCUSD) 종목은 7월14일 01:10(ET)에 1.03% 상승하여, 현재 가격은 $62821.21이고, 최근 7일간 1.33% 하락했습니다.오늘 Bitcoin(BTCUSD) 주가 상승의 요인은 무엇인가요?글로벌 매크로 환경이 더 우호적인 유동성 여건으로 전환되면서 비트코인이 강세를 보이고 있다. 최근 인플레이션 압력의 안정화는 연방준비
placeholder
미국 6월 CPI 예상보다 더 둔화, 비트코인 65,000달러 선 향해 급등TradingKey - CPI 지표가 전반적으로 예상치를 하회하며 비트코인 가격이 6만5,000달러 부근까지 급등했습니다. 비트코인이 추가 상승해 이 핵심 수준을 돌파할 수 있을까요?7월 15일, 미국의 6월 CPI 지표가 비트코인( BTC) 가격을 끌어올렸으며, 비트코인 가격은 4% 가까이 급등해 핵심 심리적 이정표인 6만5,000달러에 매우 근접한 6만
저자  Mitrade팀
7 월 15 일 수요일
TradingKey - CPI 지표가 전반적으로 예상치를 하회하며 비트코인 가격이 6만5,000달러 부근까지 급등했습니다. 비트코인이 추가 상승해 이 핵심 수준을 돌파할 수 있을까요?7월 15일, 미국의 6월 CPI 지표가 비트코인( BTC) 가격을 끌어올렸으며, 비트코인 가격은 4% 가까이 급등해 핵심 심리적 이정표인 6만5,000달러에 매우 근접한 6만
placeholder
미 증시 마감: 나스닥 0.62% 상승, 필라델피아 반도체 지수 2% 이상 하락; 기술주 시장 지지, 반도체 및 메모리주 매도세, 스페이스X 공모가 하회; 연준 인사들의 잇따른 발언TradingKey - 미국 인플레이션 지표가 둔화세를 이어가면서 연방준비제도(Fed·연준)가 올해 금리를 급격히 인상할 필요가 없을 것이라는 시장의 기대감이 고조되었다. 미국 3대 주요 지수는 일제히 상승했고 대형 기술주도 강세를 보였으나, 반도체 및 메모리 주는 매도세를 나타냈다.장 마감 기준, 다우존스 산업평균지수는 0.29% 상승한 52,658.64
저자  Mitrade팀
7 월 16 일 목요일
TradingKey - 미국 인플레이션 지표가 둔화세를 이어가면서 연방준비제도(Fed·연준)가 올해 금리를 급격히 인상할 필요가 없을 것이라는 시장의 기대감이 고조되었다. 미국 3대 주요 지수는 일제히 상승했고 대형 기술주도 강세를 보였으나, 반도체 및 메모리 주는 매도세를 나타냈다.장 마감 기준, 다우존스 산업평균지수는 0.29% 상승한 52,658.64
placeholder
은(XAGUSD) 종목이 7월16일에 2.04% 하락했습니다. 무엇이 이 움직임을 이끌고 있나요?은 (XAGUSD) 종목은 7월16일 04:15(ET)에 2.04% 하락하여, 현재 가격은 $56.555이고, 최근 7일간 5.62% 하락했습니다.오늘 은(XAGUSD) 주가 하락의 요인은 무엇인가요?은 가격의 하락세는 주로 미국의 견조한 경제 지표 발표 이후 금리 전망이 재조정된 데 따른 반응이다. 예상보다 강한 소매판매 지표와 노동시장의 지속적인 회복력
저자  Mitrade팀
7 월 16 일 목요일
은 (XAGUSD) 종목은 7월16일 04:15(ET)에 2.04% 하락하여, 현재 가격은 $56.555이고, 최근 7일간 5.62% 하락했습니다.오늘 은(XAGUSD) 주가 하락의 요인은 무엇인가요?은 가격의 하락세는 주로 미국의 견조한 경제 지표 발표 이후 금리 전망이 재조정된 데 따른 반응이다. 예상보다 강한 소매판매 지표와 노동시장의 지속적인 회복력
placeholder
Bitcoin(BTCUSD) 종목이 7월17일에 1.11% 하락한 이유를 확인해 보세요Bitcoin (BTCUSD) 종목은 7월17일 00:25(ET)에 1.11% 하락하여, 현재 가격은 $63370.41이고, 최근 7일간 0.69% 하락했습니다.오늘 Bitcoin(BTCUSD) 주가 하락의 요인은 무엇인가요?비트코인의 최근 가격 움직임은 시장 참가자들이 연방준비제도(연준)의 금리 경로에 대한 전망을 재조정하면서 글로벌 유동성 여건이 전반적
저자  Mitrade팀
7 월 17 일 금요일
Bitcoin (BTCUSD) 종목은 7월17일 00:25(ET)에 1.11% 하락하여, 현재 가격은 $63370.41이고, 최근 7일간 0.69% 하락했습니다.오늘 Bitcoin(BTCUSD) 주가 하락의 요인은 무엇인가요?비트코인의 최근 가격 움직임은 시장 참가자들이 연방준비제도(연준)의 금리 경로에 대한 전망을 재조정하면서 글로벌 유동성 여건이 전반적
goTop
quote