


Bitcoin Price Forecast: BTC retreats as fresh US-Iran tensions dampen risk appetite
- Bitcoin drops below $63,000 on Wednesday after facing rejection near the $64,000 resistance zone.
- Fresh tensions between the US and Iran dampen risk appetite, weighing on BTC.
- The stablecoin market contracted by 2.4% in June, marking its largest monthly decline since the 2022 TerraUSD collapse and signaling reduced liquidity and weaker buying power in the crypto market.
Bitcoin (BTC) extends its correction, trading below $63,000 on Wednesday after failing to overcome the $64,000 resistance level. The renewed tensions in the Middle East have dampened risk appetite, weighing on BTC prices. Meanwhile, a sharp contraction in the stablecoin market in June signals reduced liquidity and weaker buying power in the crypto market.
Renewed US-Iran tensions weigh on BTC
The US military launched a new wave of strikes against Iran on Tuesday following reports of attacks on three oil tankers in the Strait of Hormuz and jeopardizing the already fragile ceasefire.
Moreover, the Iranian Islamic Revolutionary Guards Corps (IRGC) said that it targeted 85 US military sites in Bahrain and Kuwait following the US ceasefire breach and added that it downed a US MQ9 drone in the country's south.
Meanwhile, the US also moved to withdraw a key concession that allowed Iran to sell oil in international markets. These renewed conflicts have heightened concerns about supply disruptions in the Strait of Hormuz, leading to a surge in Crude Oil prices.
The renewed friction directly threatens a fragile, interim US-Iran peace agreement, dampening risk appetite, with risk-sensitive assets such as Bitcoin dropping below $63,000 on Wednesday. If the skirmishes further escalate this week, BTC could see a sharp correction.
Other signs of concern
According to Walter Bloomberg's post on X, the stablecoin market contracted by 2.4% ($7.7 billion) to $312 billion in June, marking its largest monthly decline since the 2022 TerraUSD collapse. The decline coincided with a 20% drop in BTC, signaling reduced liquidity and weaker buying power.
If this trend continues in July, BTC and other cryptos could see further selling as contraction in stablecoin supply suggests fresh capital is leaving the crypto ecosystem, adding to downside risks.
Will institutional demand provide some cushion to falling prices?
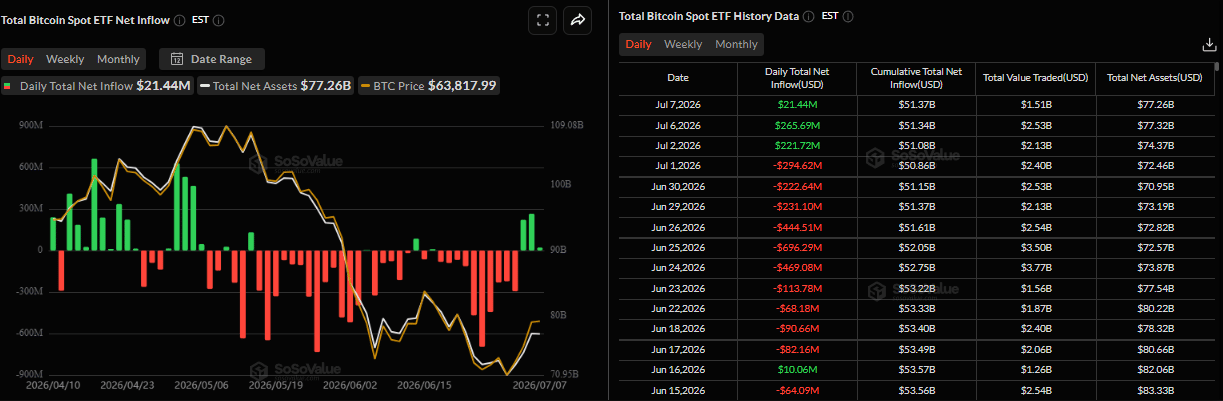
Institutional demand revives slightly so far this week. SoSoValue data shows that spot BTC ETFs recorded a mild inflow of $21.44 million on Tuesday, marking the third day of inflows. However, the strength of these flows remains weak compared to the outflows seen in recent weeks, failing to provide the cushion effect for falling BTC prices. Moreover, if these turn negative, BTC could see further correction.
Bitcoin Price Forecast: The $64,000 resistance holds strong
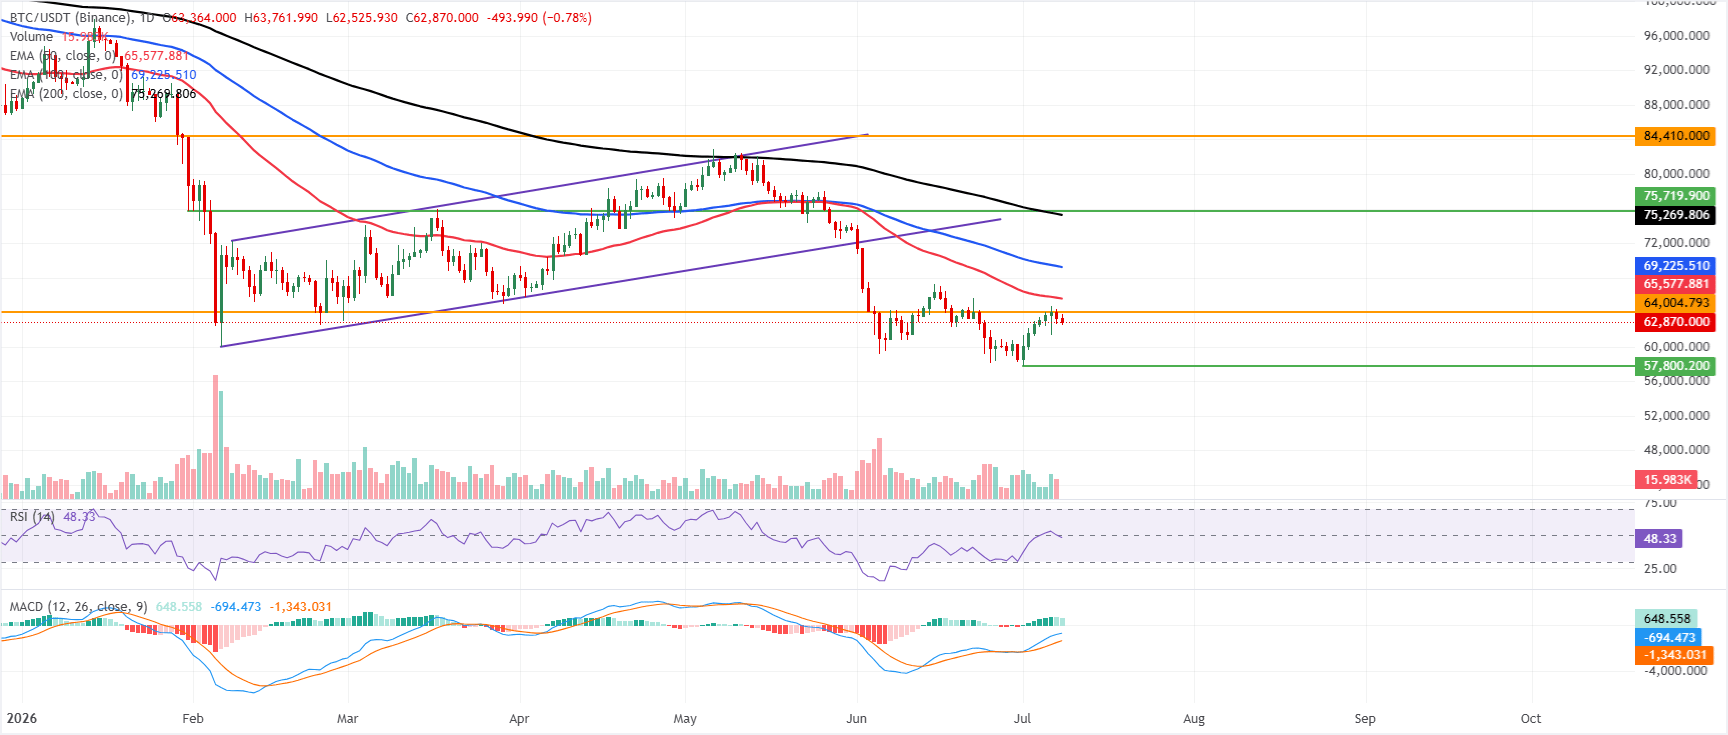
Bitcoin price trades at $62,870 on Wednesday after failing to overcome the $64,000 resistance level. BTC is maintaining a bearish near-term bias as it remains below the 50-day, 100-day, and 200-day Exponential Moving Averages (EMAs) at $65,577, $69,225, and $75,269, respectively.
The dense overhead alignment of these EMAs suggests rallies remain corrective within a broader downside phase, even as the Relative Strength Index (RSI) stabilizes around a neutral 48 and the Moving Average Convergence Divergence (MACD) stays positive, hinting at waning but not yet reversed bearish pressure.
On the topside, initial resistance is seen at the horizontal barrier near $64,004, followed by the 50-day EMA at $65,577, while the 100-day EMA at $69,225 and the 200-day EMA at $75,269 reinforce a wider supply zone before the major ceiling at $84,410.
On the downside, the absence of clearly defined nearby supports in the provided data suggests that any renewed selling below $62,000 would extend the correction toward the yearly low of $57,800 seen on July 1.
(The technical analysis of this story was written with the help of an AI tool. Know more.)
Crypto ETF FAQs
An Exchange-Traded Fund (ETF) is an investment vehicle or an index that tracks the price of an underlying asset. ETFs can not only track a single asset, but a group of assets and sectors. For example, a Bitcoin ETF tracks Bitcoin’s price. ETF is a tool used by investors to gain exposure to a certain asset.
Yes. The first Bitcoin futures ETF in the US was approved by the US Securities & Exchange Commission in October 2021. A total of seven Bitcoin futures ETFs have been approved, with more than 20 still waiting for the regulator’s permission. The SEC says that the cryptocurrency industry is new and subject to manipulation, which is why it has been delaying crypto-related futures ETFs for the last few years.
Yes. The SEC approved in January 2024 the listing and trading of several Bitcoin spot Exchange-Traded Funds, opening the door to institutional capital and mainstream investors to trade the main crypto currency. The decision was hailed by the industry as a game changer.
The main advantage of crypto ETFs is the possibility of gaining exposure to a cryptocurrency without ownership, reducing the risk and cost of holding the asset. Other pros are a lower learning curve and higher security for investors since ETFs take charge of securing the underlying asset holdings. As for the main drawbacks, the main one is that as an investor you can’t have direct ownership of the asset, or, as they say in crypto, “not your keys, not your coins.” Other disadvantages are higher costs associated with holding crypto since ETFs charge fees for active management. Finally, even though investing in ETFs reduces the risk of holding an asset, price swings in the underlying cryptocurrency are likely to be reflected in the investment vehicle too.
추천 기사


