


Bitcoin Price Forecast: BTC faces rejection at $64,000 amid persistent ETF outflows
- Bitcoin faces rejection around the key resistance level of $64,000 on Monday, after recovering over 6% in the previous week.
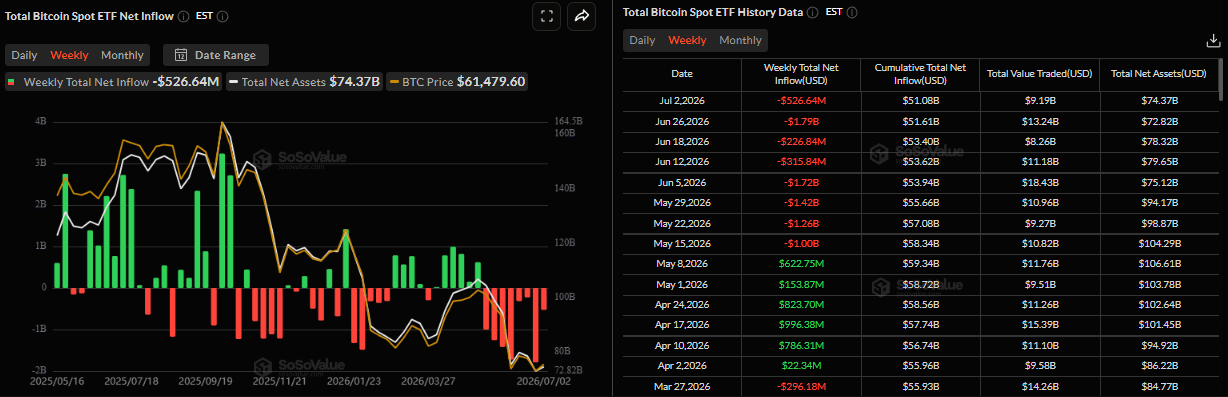
- US-listed spot ETFs recorded weekly outflows of $526.26 million through Friday, marking the eighth consecutive week of withdrawals.
- Geopolitical uncertainty remains elevated despite a fragile US-Iran interim agreement, with renewed concerns over the Strait of Hormuz keeping investors cautious.
Bitcoin (BTC) is struggling below $64,000 on Monday after recovering more than 6% over the previous week. Institutional selling continued, with spot Exchange Traded Funds (ETFs) recording net outflows of over $520 million last week, marking the eighth consecutive week of withdrawals. Meanwhile, renewed concerns over the Strait of Hormuz keep investors cautious, capping the potential upside move for the Crypto King.
Institutional selling continues
Institutional demand continued to weaken. SoSoValue data show that spot BTC ETFs recorded an outflow of $526.64 million last week, marking the eighth consecutive week of outflows since mid-May. If this outflow trend continues and intensifies this week, BTC could see a correction ahead.
Geopolitical uncertainty remains elevated
Bitcoin rallied more than 6% last week as easing geopolitical tensions following a fragile US-Iran interim agreement improved risk sentiment. However, the relief appears limited, as tensions over the Strait of Hormuz persist, after Iran's ambassador to China said on Saturday that Tehran plans to introduce new service fees for ships passing through the strategically important waterway. The US and its Gulf allies have repeatedly rejected the idea of Iran charging vessels for using the strait. This keeps the geopolitical risk premium in play, dampening the risk appetite and cautious tone among investors, with Bitcoin struggling below $64,000 on Monday.
Bitcoin Price Forecast: BTC faces rejection around $64,000
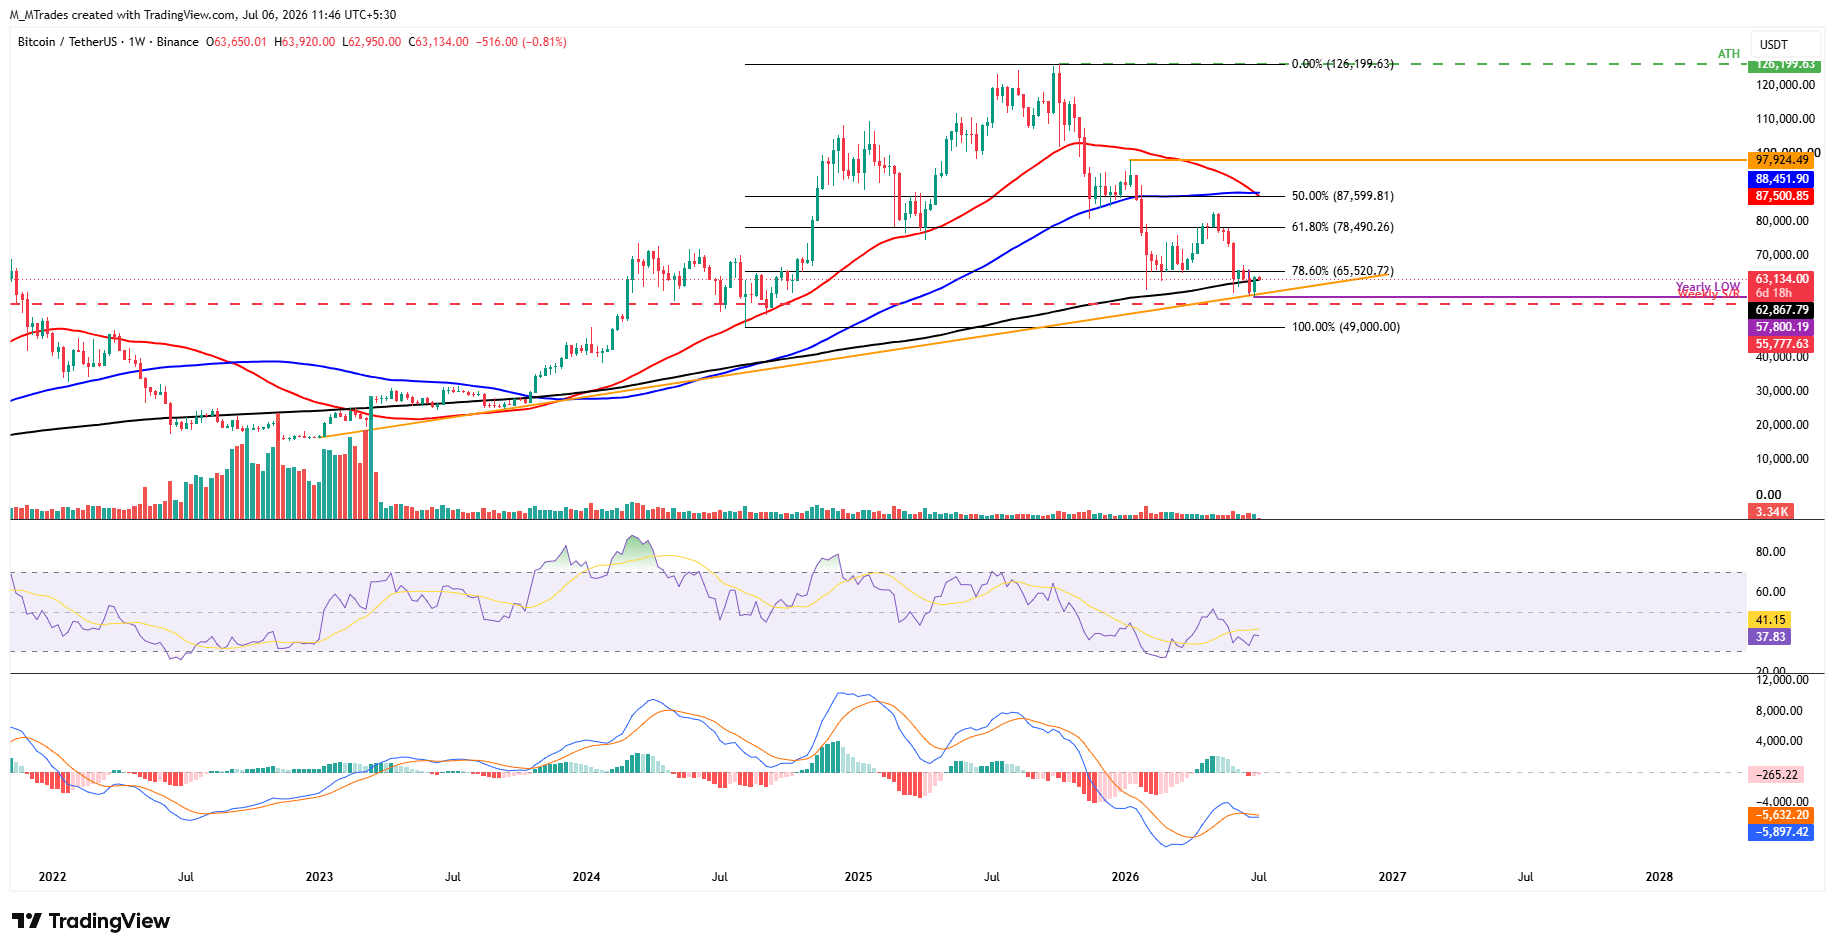
Bitcoin recovered over 6% and closed above the 200-week Simple Moving Average (SMA) at $62,867 after finding support around the ascending trendline (drawn by connecting multiple lows since January 2023) in the previous week. However, at the start of this week on Monday, BTC is trading slightly lower around $63,134.
If the 200-week SMA at $62,867 holds as support, BTC could extend gains toward the 78.60% Fibonacci retracement level at $65,520 (from the August 2024 low of $49,000 to the October 2025 record high of $126,199).
Momentum indicators on the weekly chart show cautious signs: a negative Moving Average Convergence Divergence (MACD) and a subdued Relative Strength Index (RSI) near 38 suggest downside momentum is still in play rather than exhausted.
However, if BTC continues its correction and closes below the 200-Week SMA at $62,867, it could extend the decline toward the ascending trendline support at roughly $58,000.
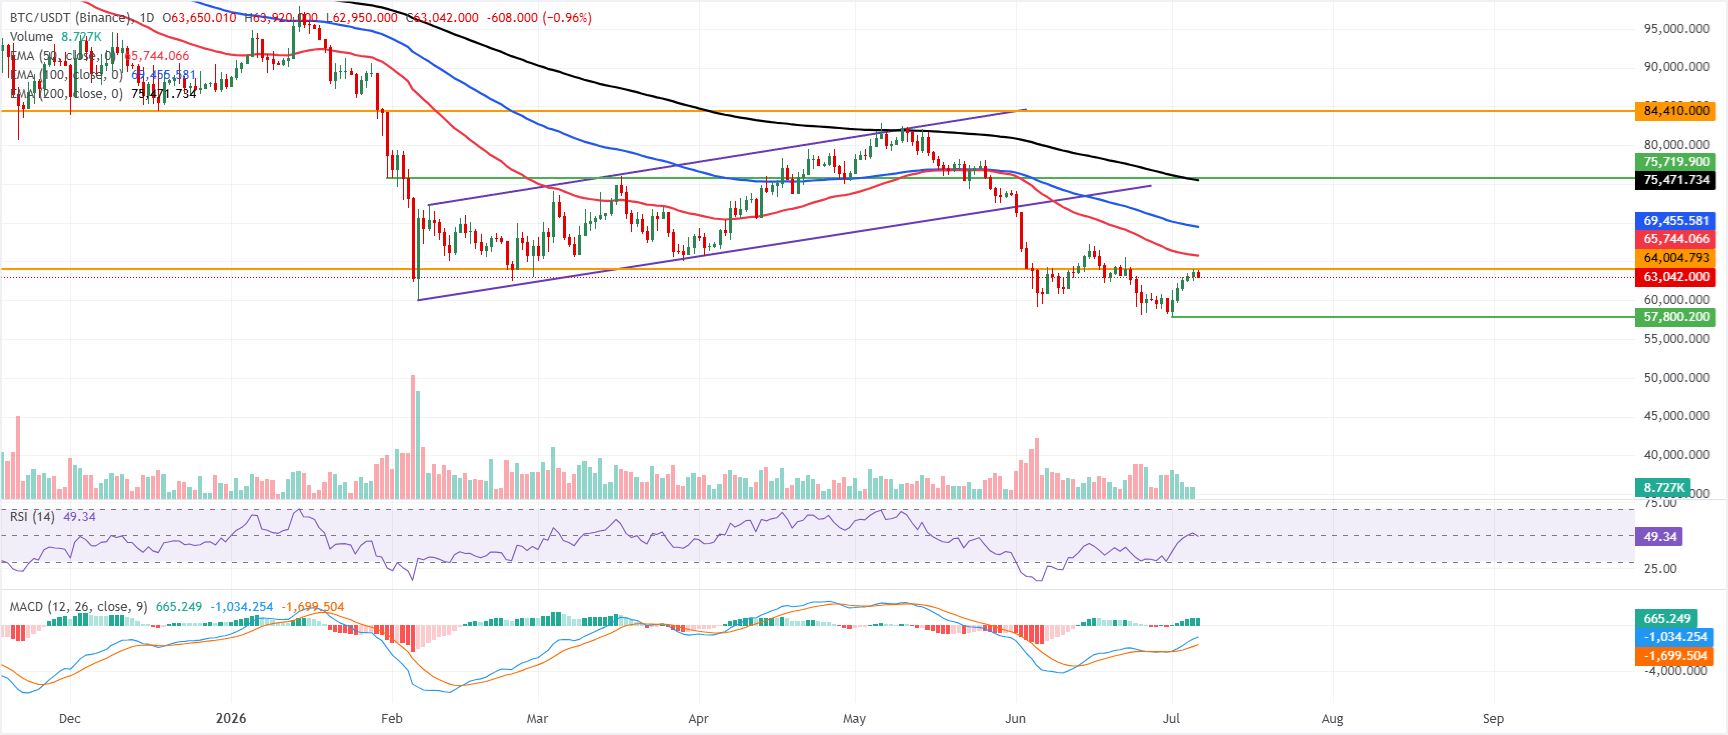
On the daily chart, BTC is maintaining a capped bias, with price remaining below the 50-day, 100-day, and 200-day Exponential Moving Averages (EMAs), all of which sit well above spot.
The immediate ceiling is the horizontal level around $64,004, with the 50-day EMA near $65,744 adding to overhead supply further up, while the longer-term 100-day and 200-day EMAs near $69,455 and $75,471, respectively, reinforce a broader bearish structure despite a modestly positive Relative Strength Index (RSI) around 49 and a firmly positive Moving Average Convergence Divergence (MACD), which hint at improving but still constrained momentum.
On the topside, a break above the nearby horizontal resistance at $64,004 would open the door toward the 50-day EMA at $65,744, followed by the 100-day EMA at $69,455 and the 200-day EMA at $75,471, before the more distant horizontal barrier around $84,410 comes into focus.
On the downside, the absence of clearly defined nearby supports in the provided data suggests that any renewed selling below $63,000 would extend the correction toward the yearly low of $57,800.
(The technical analysis of this story was written with the help of an AI tool.)
Bitcoin, altcoins, stablecoins FAQs
Bitcoin is the largest cryptocurrency by market capitalization, a virtual currency designed to serve as money. This form of payment cannot be controlled by any one person, group, or entity, which eliminates the need for third-party participation during financial transactions.
Altcoins are any cryptocurrency apart from Bitcoin, but some also regard Ethereum as a non-altcoin because it is from these two cryptocurrencies that forking happens. If this is true, then Litecoin is the first altcoin, forked from the Bitcoin protocol and, therefore, an “improved” version of it.
Stablecoins are cryptocurrencies designed to have a stable price, with their value backed by a reserve of the asset it represents. To achieve this, the value of any one stablecoin is pegged to a commodity or financial instrument, such as the US Dollar (USD), with its supply regulated by an algorithm or demand. The main goal of stablecoins is to provide an on/off-ramp for investors willing to trade and invest in cryptocurrencies. Stablecoins also allow investors to store value since cryptocurrencies, in general, are subject to volatility.
Bitcoin dominance is the ratio of Bitcoin's market capitalization to the total market capitalization of all cryptocurrencies combined. It provides a clear picture of Bitcoin’s interest among investors. A high BTC dominance typically happens before and during a bull run, in which investors resort to investing in relatively stable and high market capitalization cryptocurrency like Bitcoin. A drop in BTC dominance usually means that investors are moving their capital and/or profits to altcoins in a quest for higher returns, which usually triggers an explosion of altcoin rallies.
추천 기사


