

Ripple Price Forecast: XRP falters near $1.00 as demand dries up
- XRP sustains selling pressure, steadily approaching the critical $1.00 threshold on Wednesday amid intensifying bearish momentum.
- Investor appetite for XRP-linked products continues to wane, evidenced by modest ETF outflows and a persistent drop in retail participation.
- XRP’s technical outlook remains bearish, with the RSI hovering near oversold levels and the MACD sustaining a sell signal.
Ripple (XRP) is trading around $1.04 at the time of writing on Wednesday, grinding toward the psychological $1.00 support. The remittance sector continues to struggle to make meaningful rebounds, reflecting persistent headwinds across the broader crypto market.
Moreover, investor sentiment remains cautious, as evidenced by ongoing outflows from digital asset products and a sluggish derivatives market.
XRP lags recovery as risk-averse sentiment persists
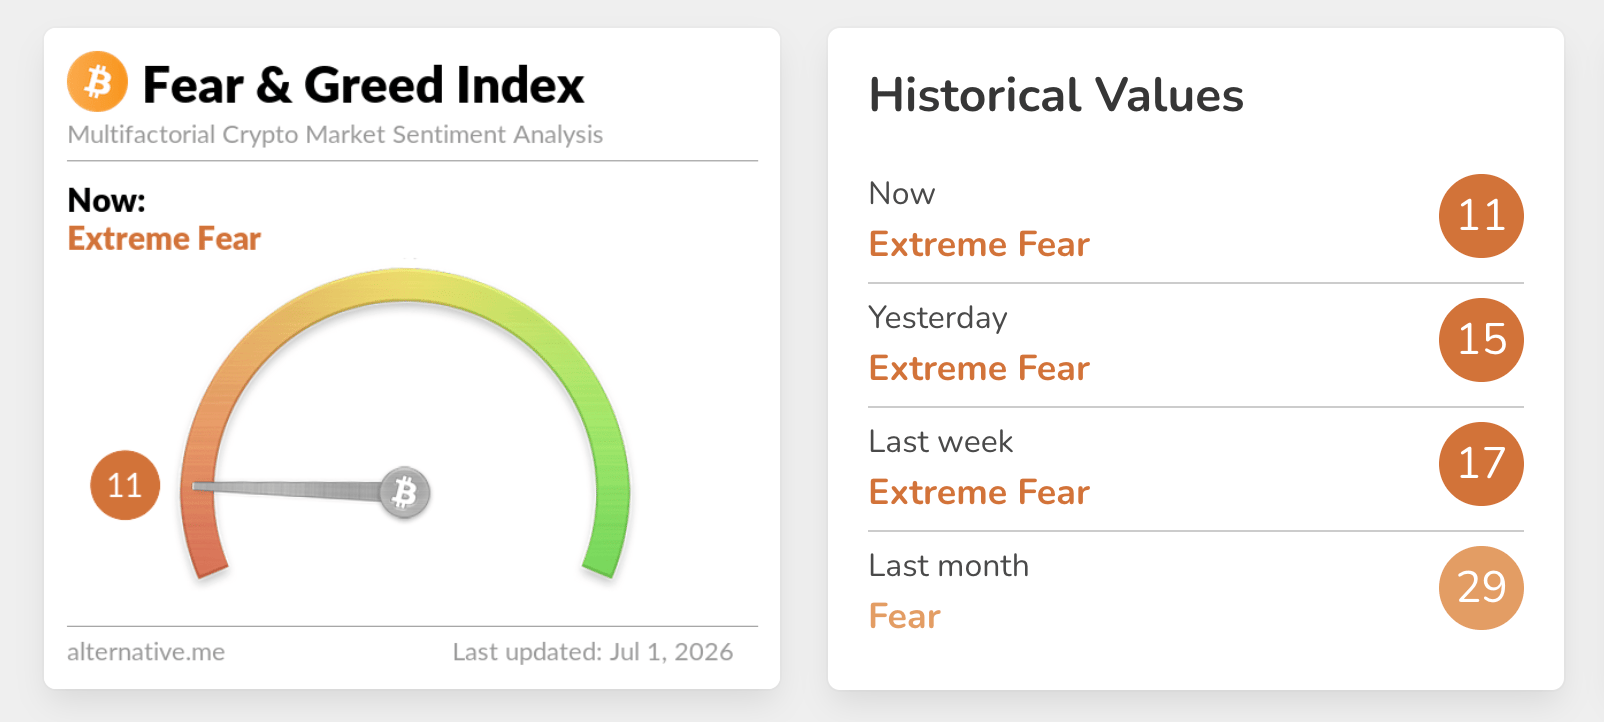
Market sentiment across the crypto sector has deteriorated significantly in the past few weeks, with the Fear & Greed Index lingering in Extreme Fear territory at 15 as of Wednesday, down from 15 the previous day. This persistent risk aversion continues to suppress demand for risk assets and keeps price action tightly constrained.
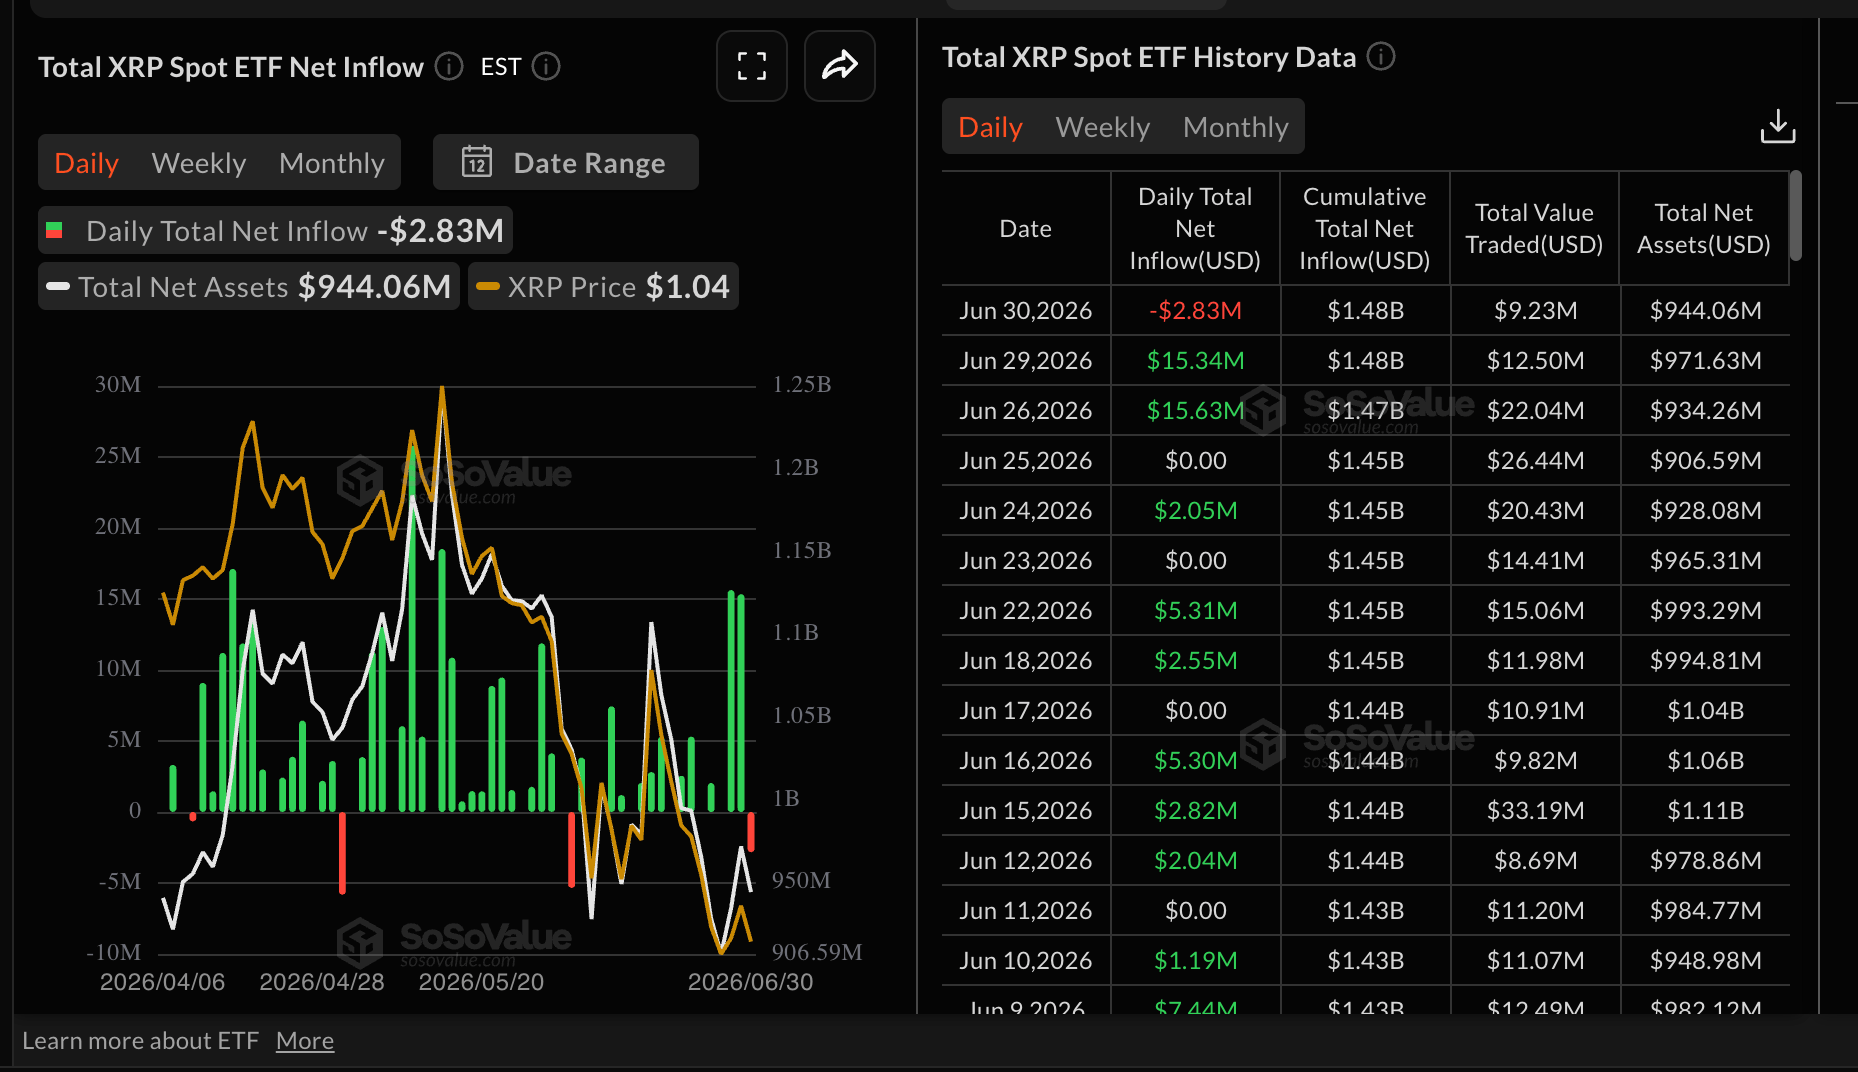
XRP spot ETFs saw a reversal in investor flows, recording almost $3 million in outflows on Tuesday following substantial inflows of $16 million on Friday and $15 million on Monday.
Despite recent volatility, cumulative inflows remain stable at $1.48 billion, with average net assets under management at $944 million, according to SoSoValue data. This shows that while short-term sentiment is wavering, longer-term investor interest in XRP products has proven resilient amid ongoing market challenges.
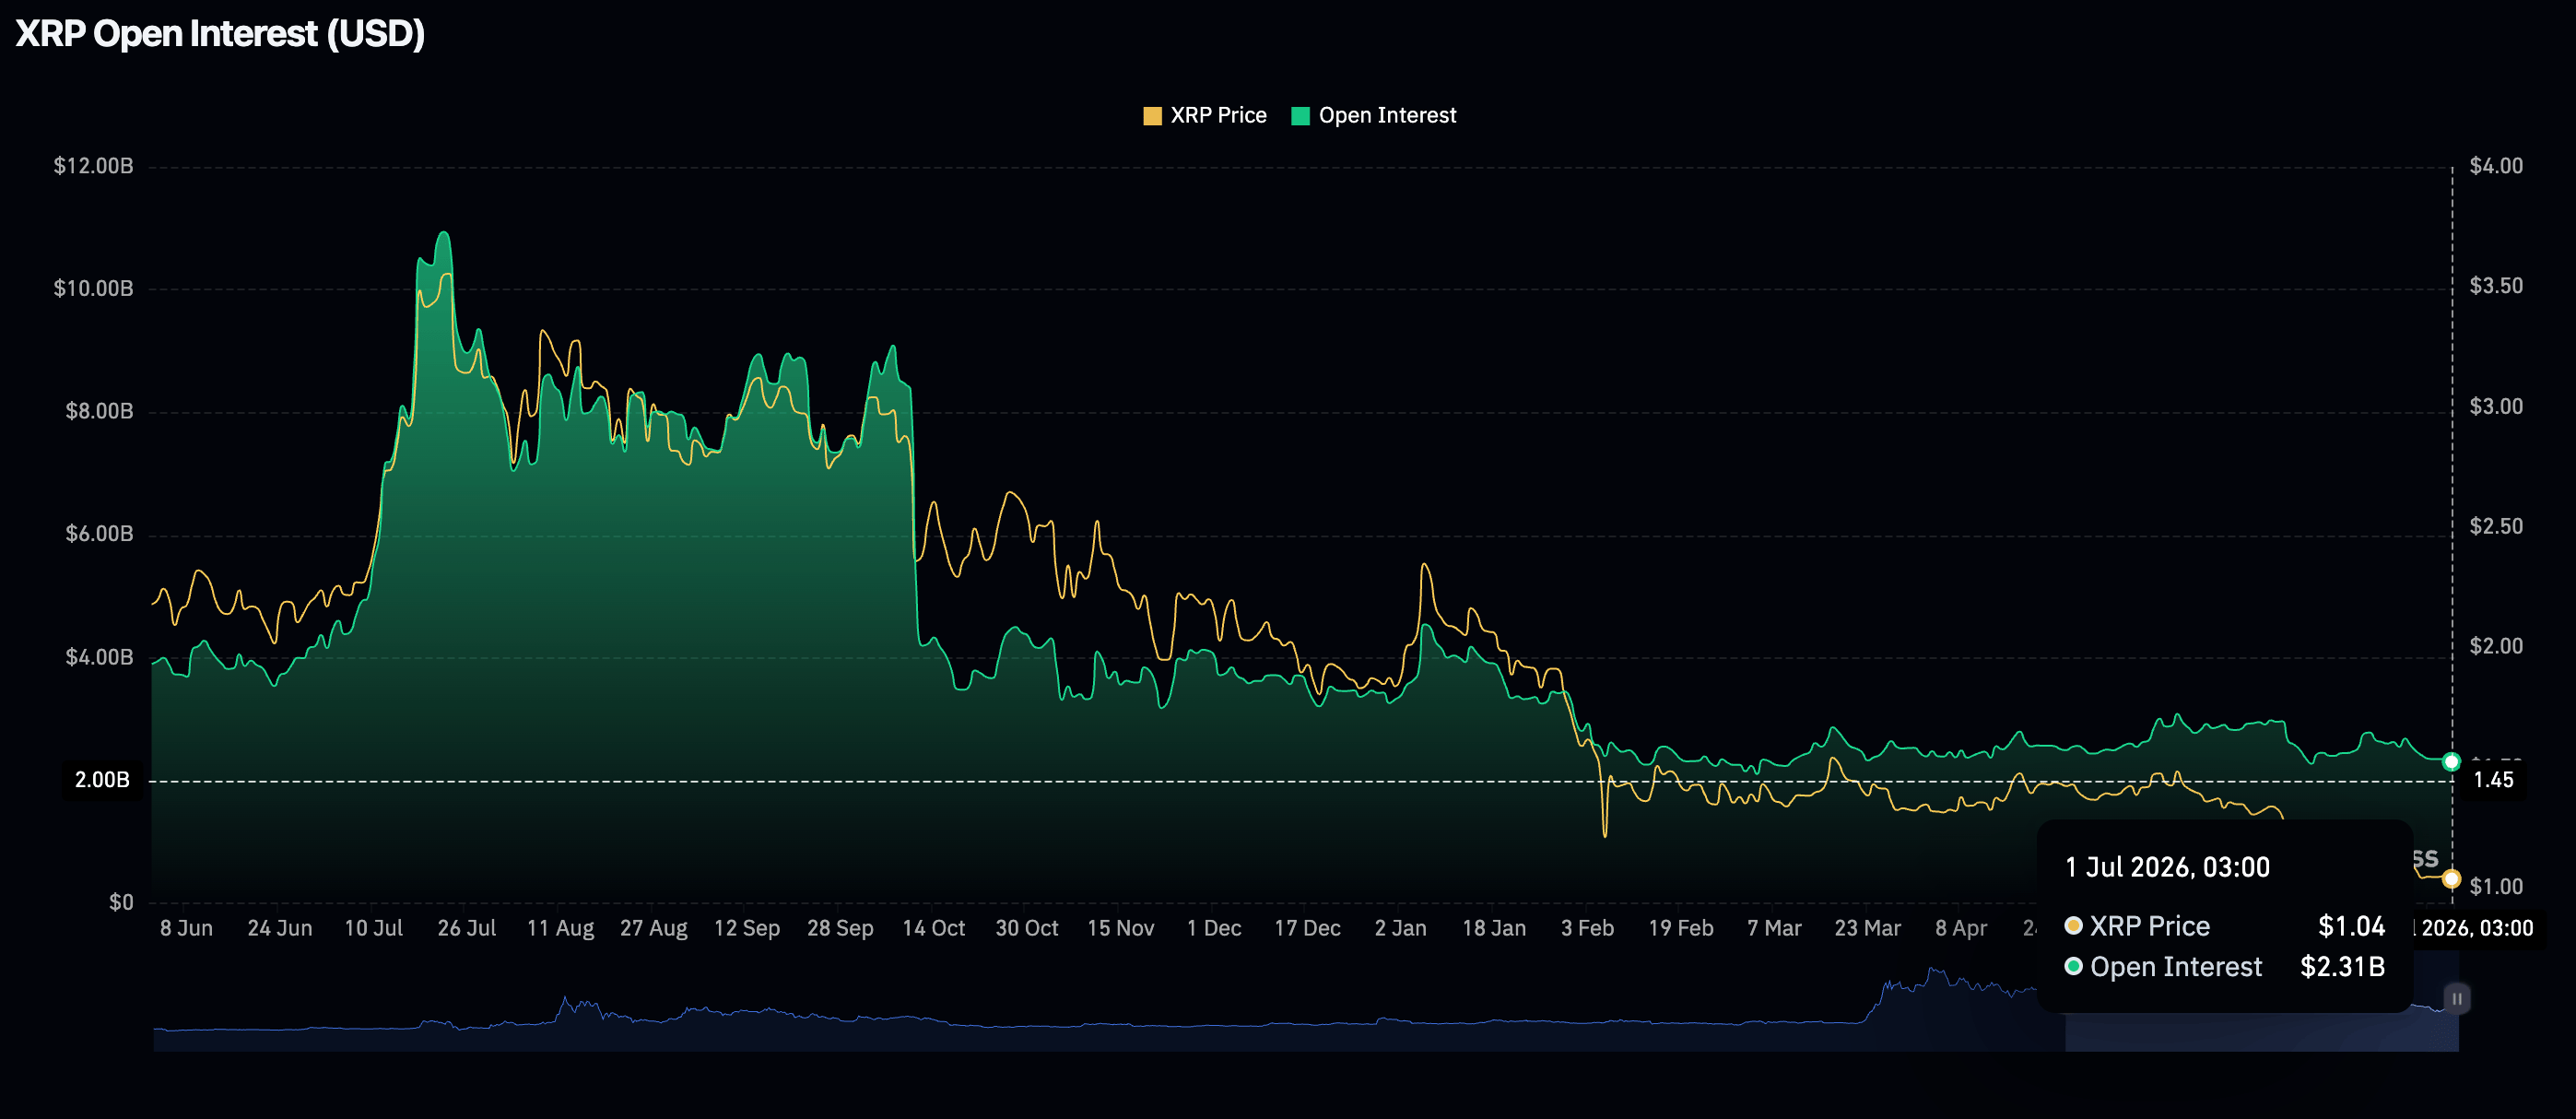
Robust institutional participation remains critical to offset the ongoing weakness in retail trading activity. According to CoinGlass, perpetual futures Open Interest (OI) has cooled to $2.31 billion on Wednesday, down from $2.35 billion the day before and far below the $10.94 billion peak in July. Subdued OI underscores the prevailing risk-off stance among retail investors, while sustained recovery will likely hinge on a resurgence of retail engagement.
Price analysis: XRP tests key support as headwinds linger
XRP trades at $1.04, maintaining a bearish near-term tone as price holds below the Bollinger middle band around $1.12 and all key Exponential Moving Averages (EMAs), with the 50-day EMA near $1.19 and the 100-day and 200-day EMAs much higher at $1.30 and $1.52 respectively.
The Moving Average Convergence Divergence (MACD) histogram remains fractionally negative on the daily chart while the Relative Strength Index (RSI) hovers just above the oversold area near 32, suggesting lingering downside pressure but with the potential for only modest corrective bounces while these overhead levels cap the pair.
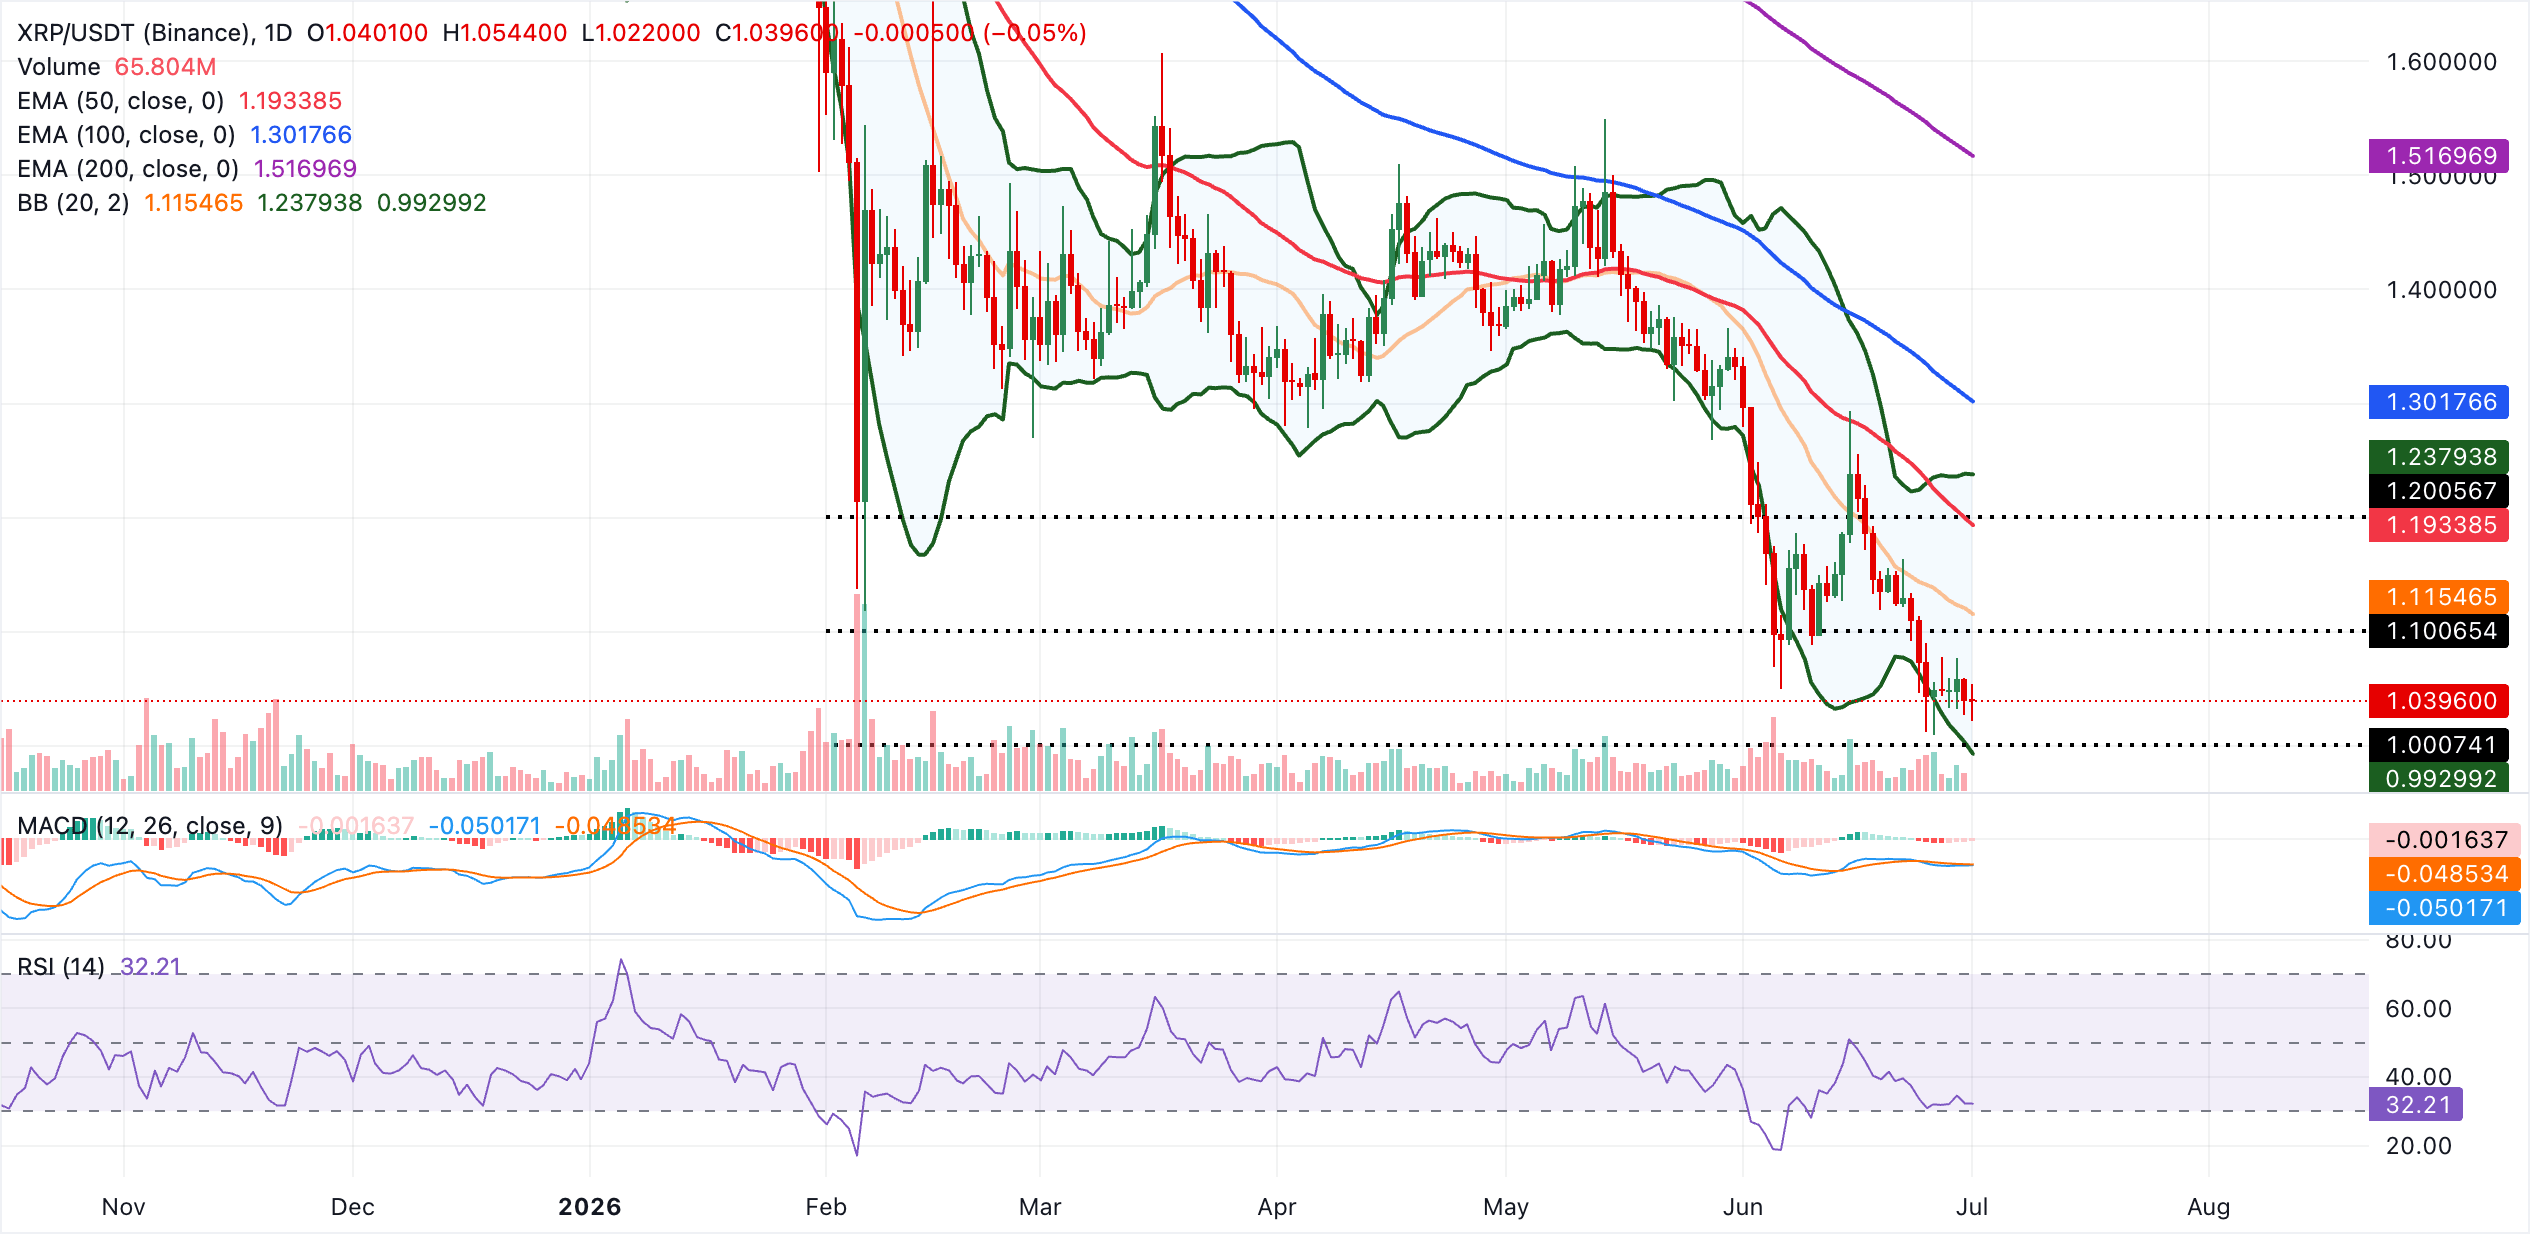
Initial resistance aligns with the Bollinger middle band near $1.12, followed by the 50-day EMA around $1.19 and the Bollinger upper band close to $1.24, with the broader bearish structure reinforced by the more distant 100-day and 200-day EMAs at roughly $1.30 and $1.52. the downside, the next notable support emerges at the Bollinger lower band around $0.99, where a decisive break would reopen the decline, while any recovery attempts are likely to struggle as long as XRP trades below the clustered moving averages overhead.
(The technical analysis of this story was written with the help of an AI tool.)
Open Interest, funding rate FAQs
Higher Open Interest is associated with higher liquidity and new capital inflow to the market. This is considered the equivalent of increase in efficiency and the ongoing trend continues. When Open Interest decreases, it is considered a sign of liquidation in the market, investors are leaving and the overall demand for an asset is on a decline, fueling a bearish sentiment among investors.
Funding fees bridge the difference between spot prices and prices of futures contracts of an asset by increasing liquidation risks faced by traders. A consistently high and positive funding rate implies there is a bullish sentiment among market participants and there is an expectation of a price hike. A consistently negative funding rate for an asset implies a bearish sentiment, indicating that traders expect the cryptocurrency’s price to fall and a bearish trend reversal is likely to occur.
추천 기사


