


Ripple Price Forecast: XRP risks extending drop as June lows come into view
- XRP remains vulnerable below the $1.20 pivotal level amid rising downside risks toward the June lows at $1.05.
- XRP muted ETF demand and softening retail interest fan headwinds.
- XRP momentum indicators battle downtrending major moving averages as sellers tighten their grip.
Ripple (XRP) ticks down below $1.20 with short-term support at $1.16 intact at the time of writing on Thursday. An early-week rally was rejected at $1.28, weighing on sentiment as traders broadly de-risked.
Investors de-risk as sentiment softens
The Federal Reserve’s (Fed) hawkish stance and the hint of a tighter monetary policy aimed at achieving the long-term 2% inflation target continue to weigh on the crypto market since the American session on Wednesday. The possibility of a rate hike in 2026 is back on the table, as Fed Chair Kevin Warsh appeared to prioritize stability over early easing in his first post-meeting press conference.
Cryptocurrencies are broadly pressured, trimming recent gains driven by improving sentiment following the United States (US) and Iran's announcement of a peace agreement to end the war.
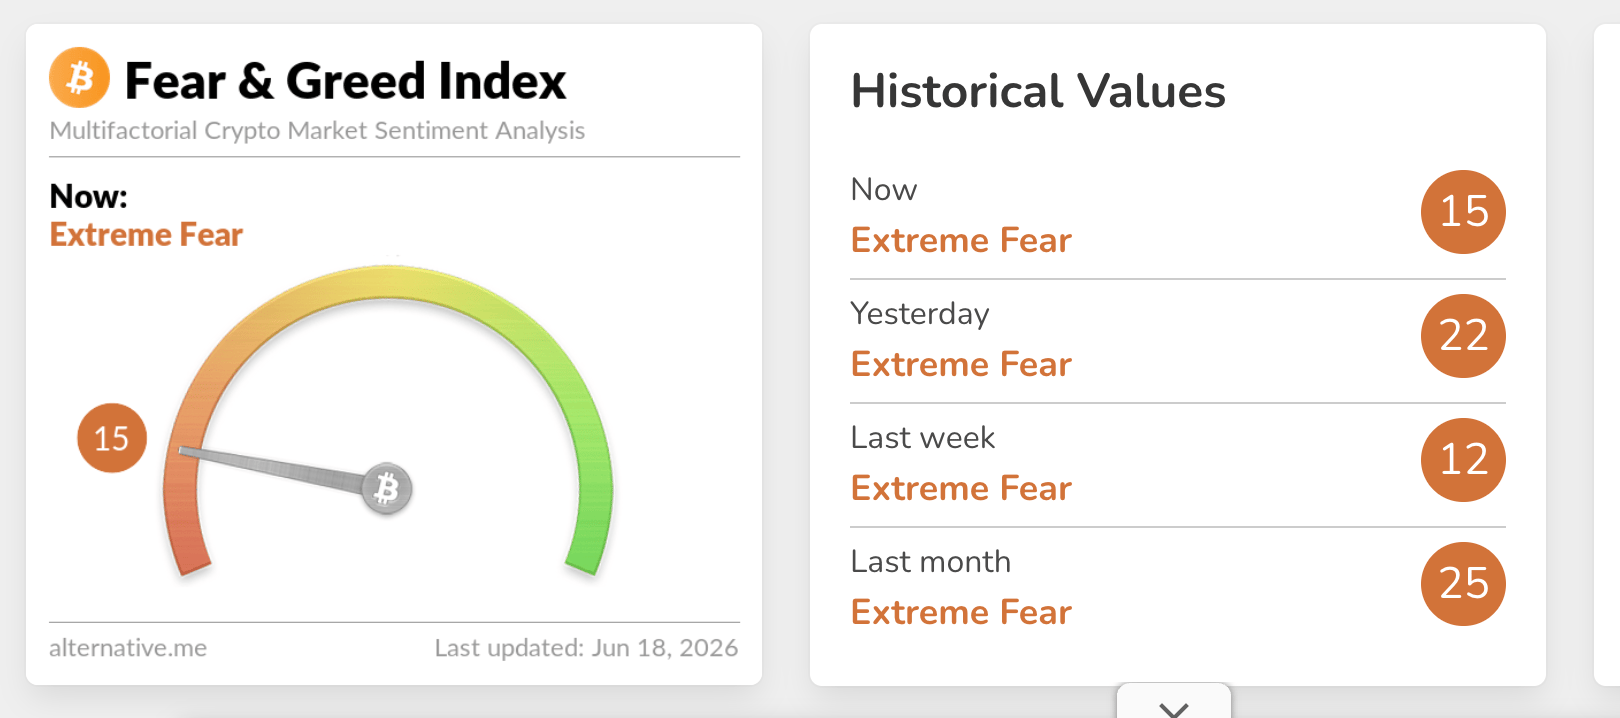
Sentiment has softened further, as reflected in the Fear & Greed Index, which holds at 15 in the Extreme Fear territory on Thursday, down from 22 the day before. This shows that investors are cautious toward risk assets, with exposure likely to remain subdued in the short term.
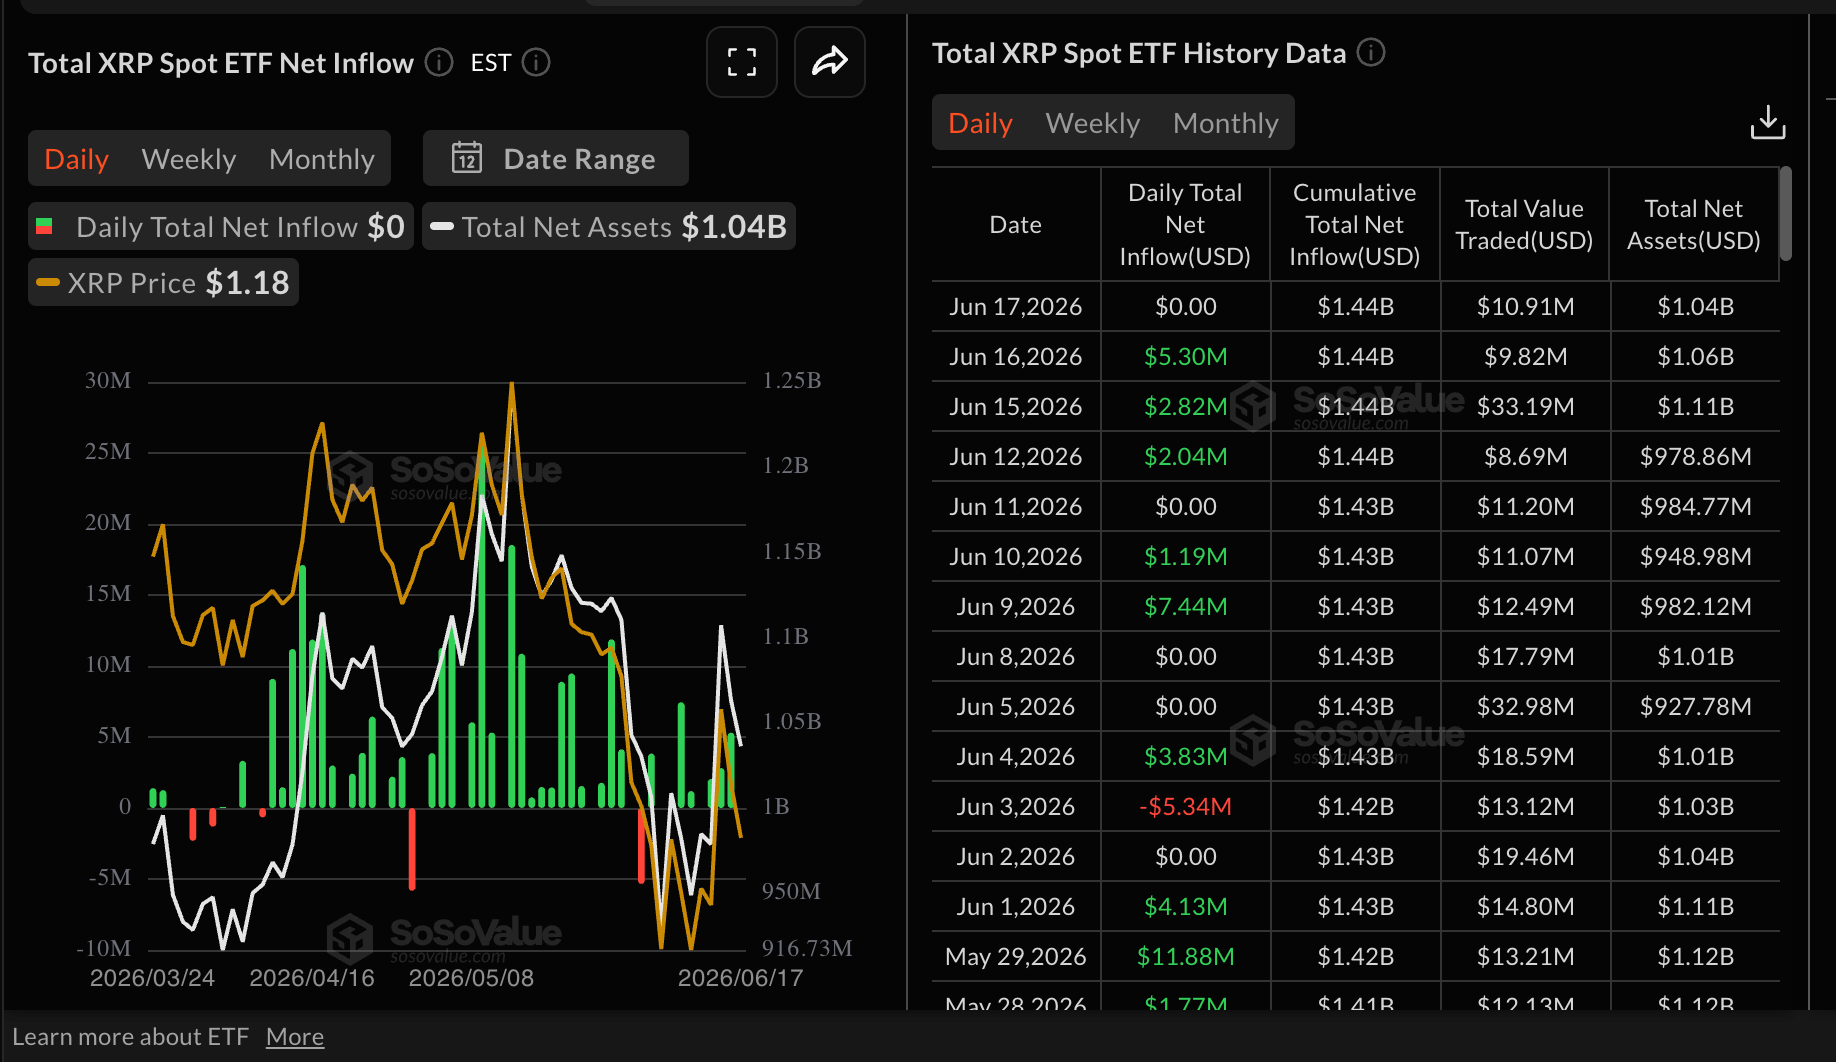
XRP spot Exchange-Traded Funds (ETFs) remained quiet, without flows recorded on Wednesday, suggesting that institutional investors have retreated following cautious demand, with inflows of nearly $3 million on Monday and $5 million on Tuesday.
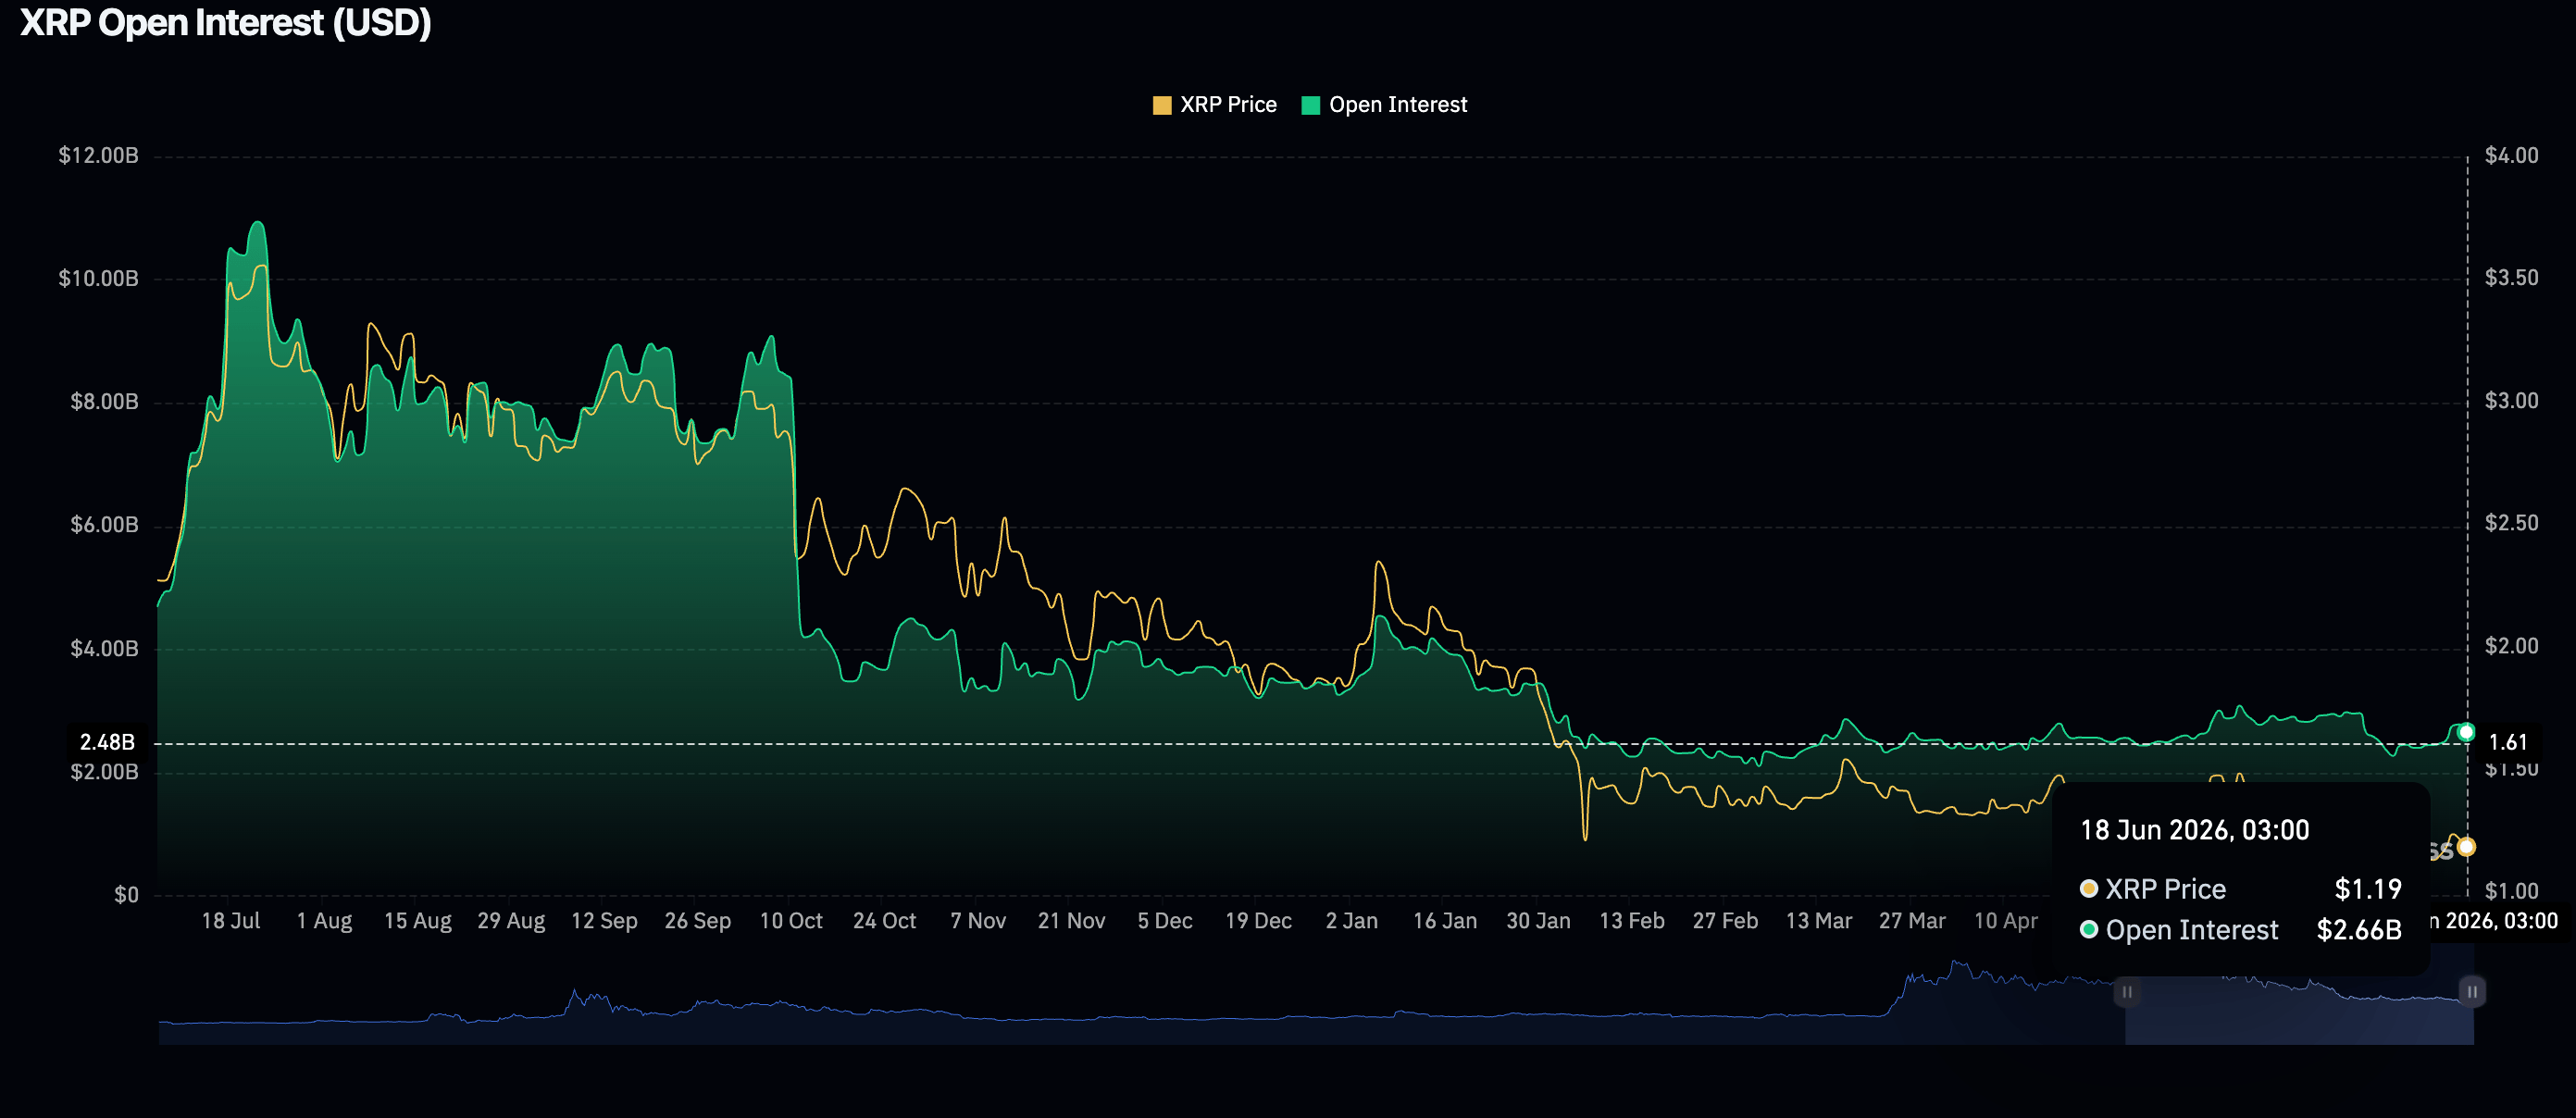
XRP futures Open Interest (OI) dropped to $2.66 billion on Thursday, down from $2.79 billion the previous day, signaling a reduction in risk appetite among market participants.
Persistent weakness in derivatives demand points to diminishing confidence in XRP’s near-term trajectory. As a result, traders appear more likely to close out positions rather than initiate fresh longs, contributing to ongoing selling pressure.
Price analysis: XRP growing downside pressure
XRP trades near $1.17, keeping a bearish near-term tone as price holds beneath the 50-day, 100-day and 200-day Exponential Moving Averages (EMAs) at $1.27, $1.37 and $1.58 respectively. Still, the Moving Average Convergence Divergence (MACD) histogram on the daily chart hints that downside momentum is easing rather than accelerating, leaving the pair in a capped but not yet capitulating configuration.
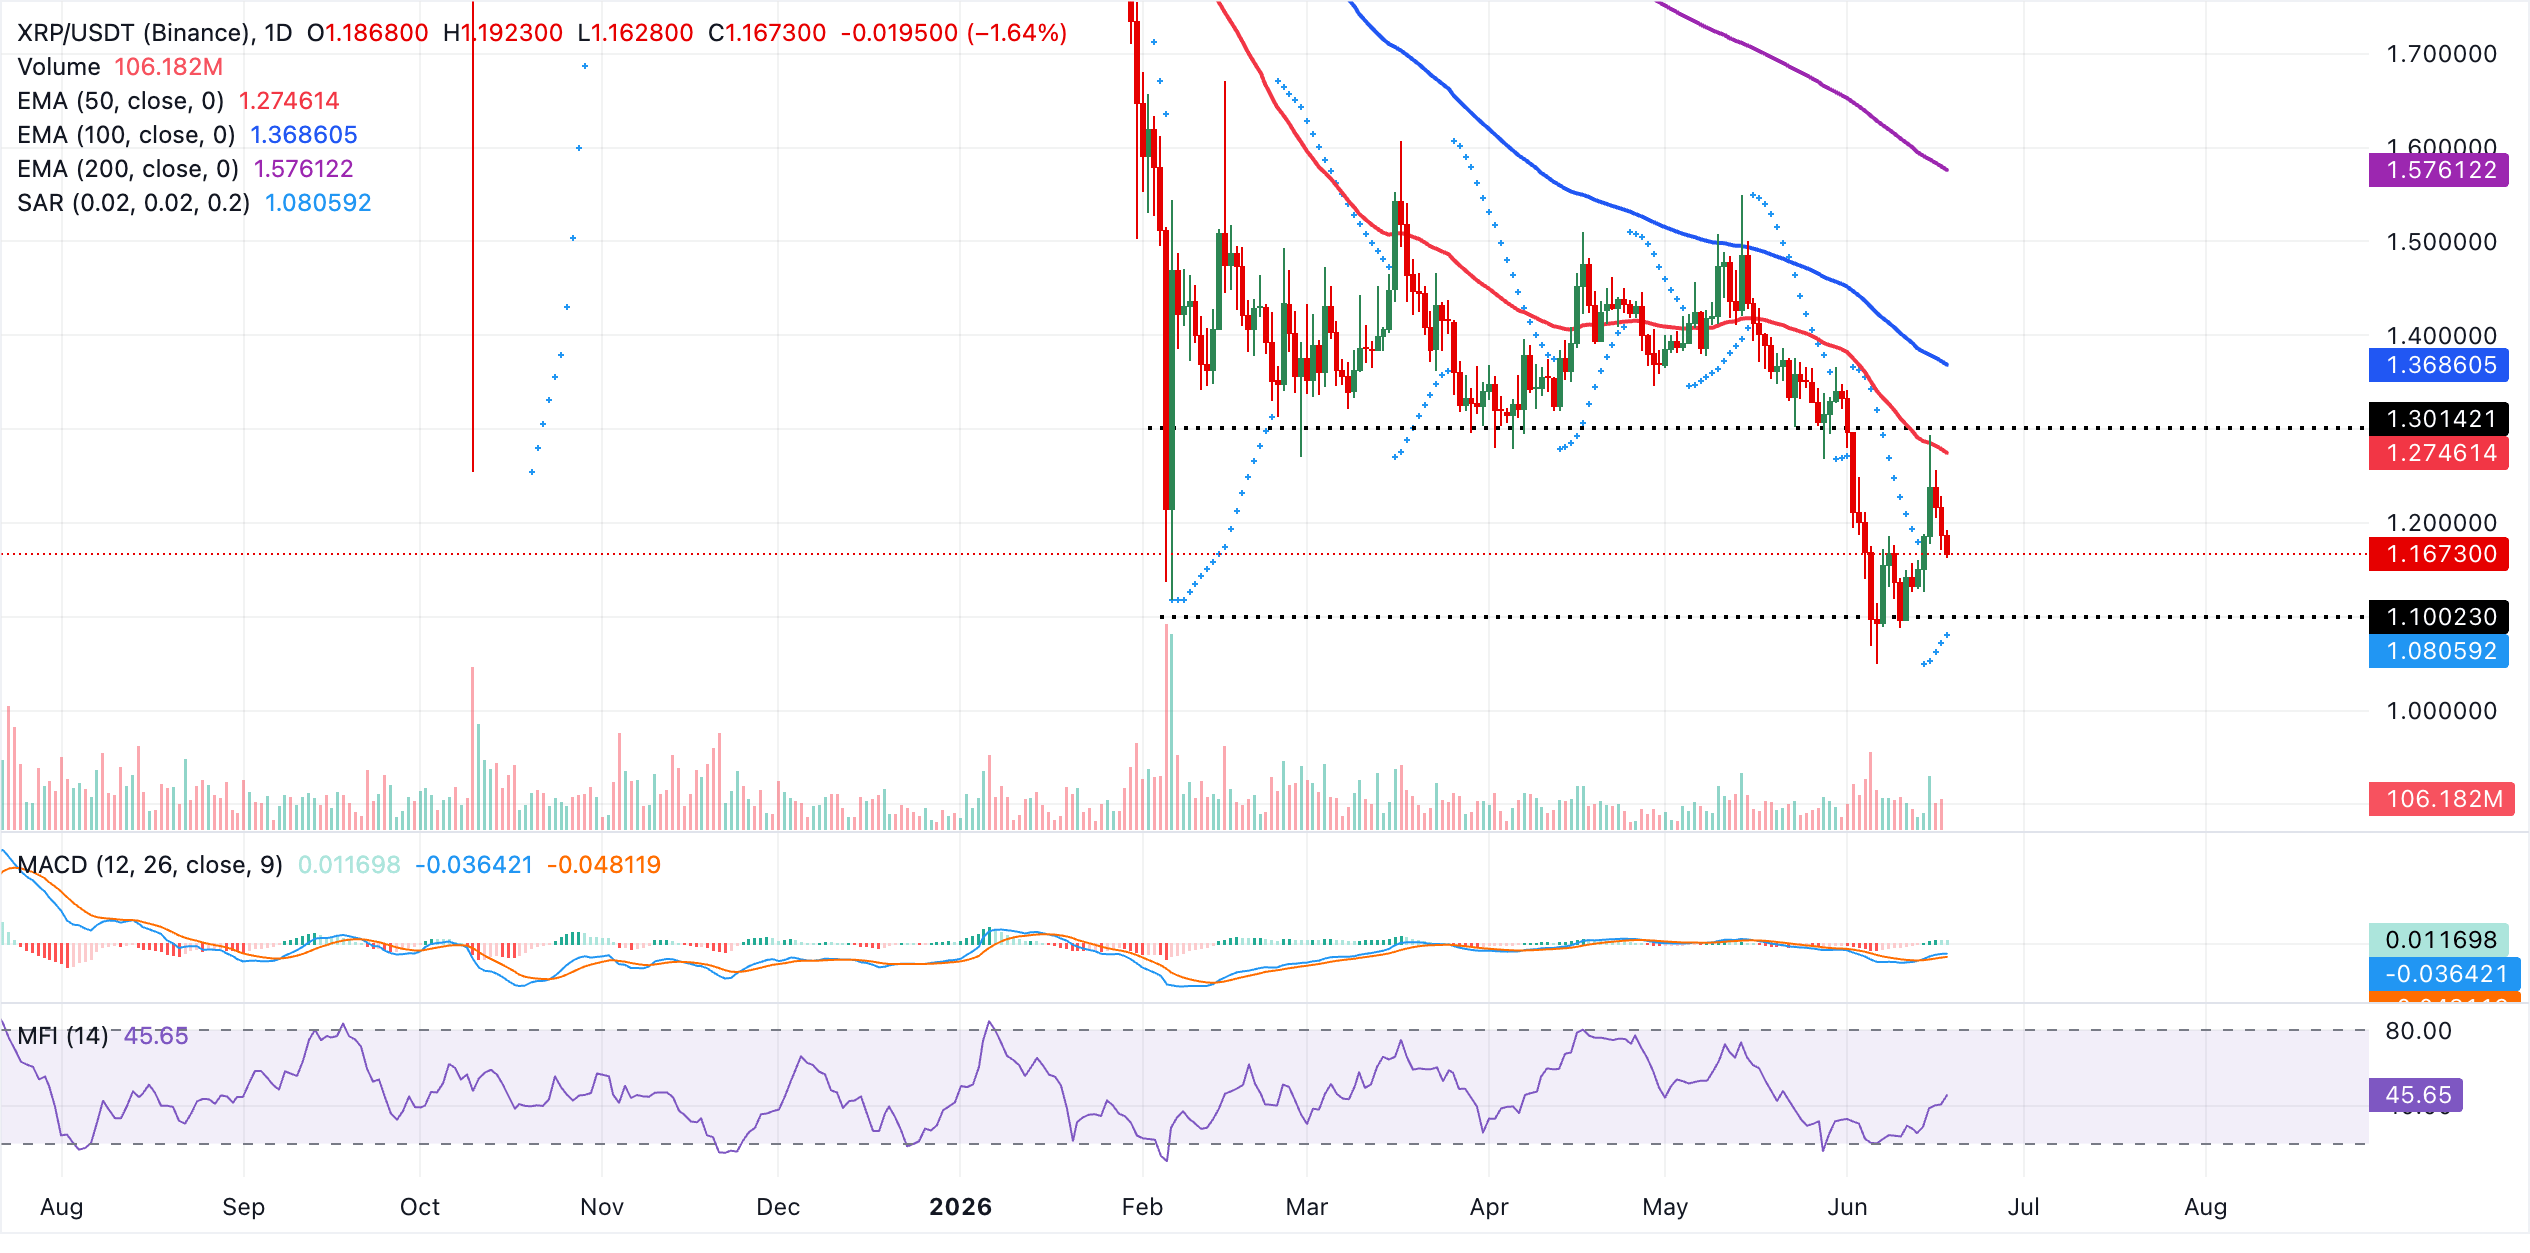
On the topside, initial resistance lies at the 50-day EMA near $1.27, with further barriers at the 100-day EMA around $1.39 and the 200-day EMA closer to $1.58, levels that would need to be reclaimed to suggest a more durable recovery. Looking down, the Parabolic SAR at $1.08 marks the first significant support. A daily close below this level would expose the pair to renewed selling pressure and potentially extend the broader corrective phase toward June lows at $1.05.
(The technical analysis of this story was written with the help of an AI tool.)
Crypto ETF FAQs
An Exchange-Traded Fund (ETF) is an investment vehicle or an index that tracks the price of an underlying asset. ETFs can not only track a single asset, but a group of assets and sectors. For example, a Bitcoin ETF tracks Bitcoin’s price. ETF is a tool used by investors to gain exposure to a certain asset.
Yes. The first Bitcoin futures ETF in the US was approved by the US Securities & Exchange Commission in October 2021. A total of seven Bitcoin futures ETFs have been approved, with more than 20 still waiting for the regulator’s permission. The SEC says that the cryptocurrency industry is new and subject to manipulation, which is why it has been delaying crypto-related futures ETFs for the last few years.
Yes. The SEC approved in January 2024 the listing and trading of several Bitcoin spot Exchange-Traded Funds, opening the door to institutional capital and mainstream investors to trade the main crypto currency. The decision was hailed by the industry as a game changer.
The main advantage of crypto ETFs is the possibility of gaining exposure to a cryptocurrency without ownership, reducing the risk and cost of holding the asset. Other pros are a lower learning curve and higher security for investors since ETFs take charge of securing the underlying asset holdings. As for the main drawbacks, the main one is that as an investor you can’t have direct ownership of the asset, or, as they say in crypto, “not your keys, not your coins.” Other disadvantages are higher costs associated with holding crypto since ETFs charge fees for active management. Finally, even though investing in ETFs reduces the risk of holding an asset, price swings in the underlying cryptocurrency are likely to be reflected in the investment vehicle too.
추천 기사


