


Crypto Today: Bitcoin, Ethereum, XRP broadly consolidate ahead of the next leg up
- Bitcoin hovers around $79,000 as bulls gather momentum for a potential breakout toward $82,500 resistance.
- Ethereum broadly holds gains, trading above $2,400, supported by upward-moving averages and a MACD buy signal.
- XRP trades above $1.40 short-term support, but its upside appears capped amid a potentially overextended bullish outlook.
Bitcoin (BTC) has retained a strong bullish outlook since last week, trading around $79,000 on Wednesday. As the Crypto King consolidates, bulls appear to be mulling another breakout attempt to reclaim $80,000 and push beyond the supply zone at $82,500. As for major altcoins, Ethereum (ETH) holds above $2,400 while building momentum for a potential breakout past $2,600.
At the same time, Ripple (XRP) is defending $1.40 support but faces capped upside, with supply building between $1.50 and $1.70. A sustained move above $2.00 is needed to reinforce the short to medium-term positive outlook. Such a move could prevent losses toward the demand area at $1.00.
Market activity backs bullish outlook
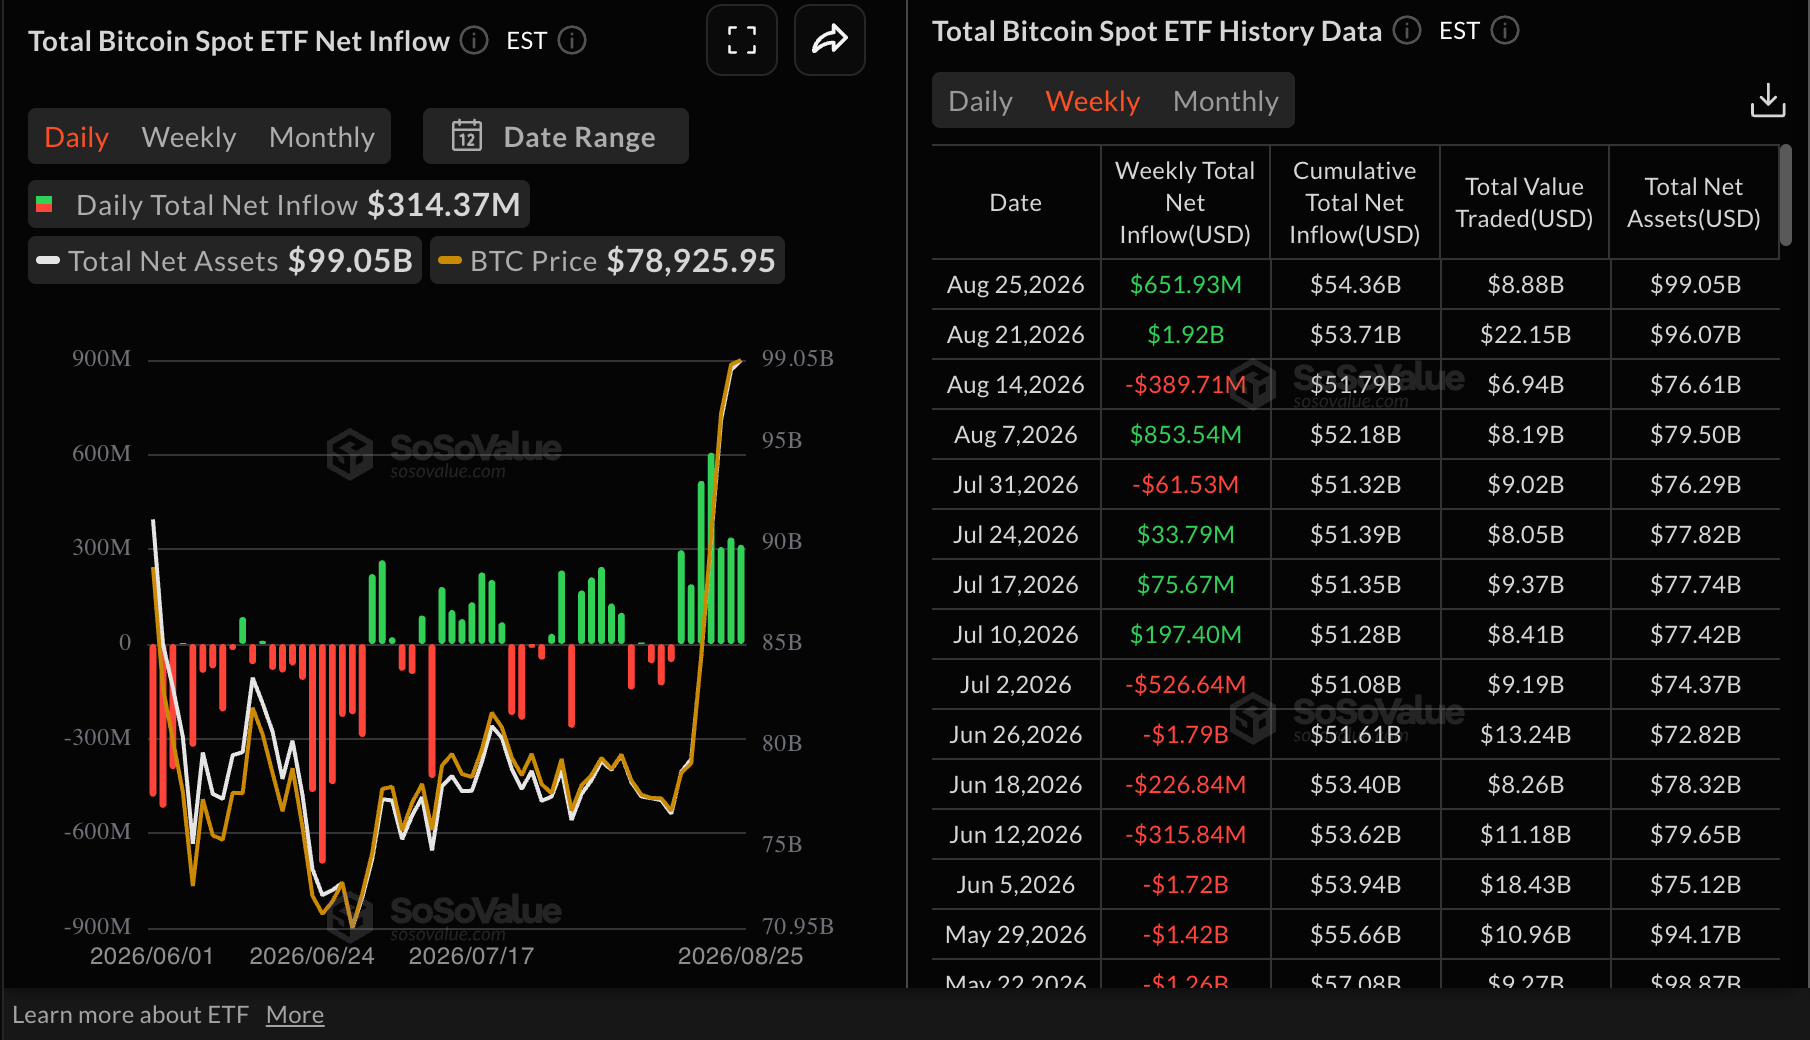
Bitcoin spot Exchange-Traded Funds (ETFs) have extended a notable bullish streak, with inflows averaging $314 million on Tuesday. Last week’s inflows surged to $1.92 billion, the strongest since October, underscoring an institutional investor comeback following months of uncertainty and price doldrums. Cumulative inflows total $54.36 billion, with assets under management at $99.05 billion.
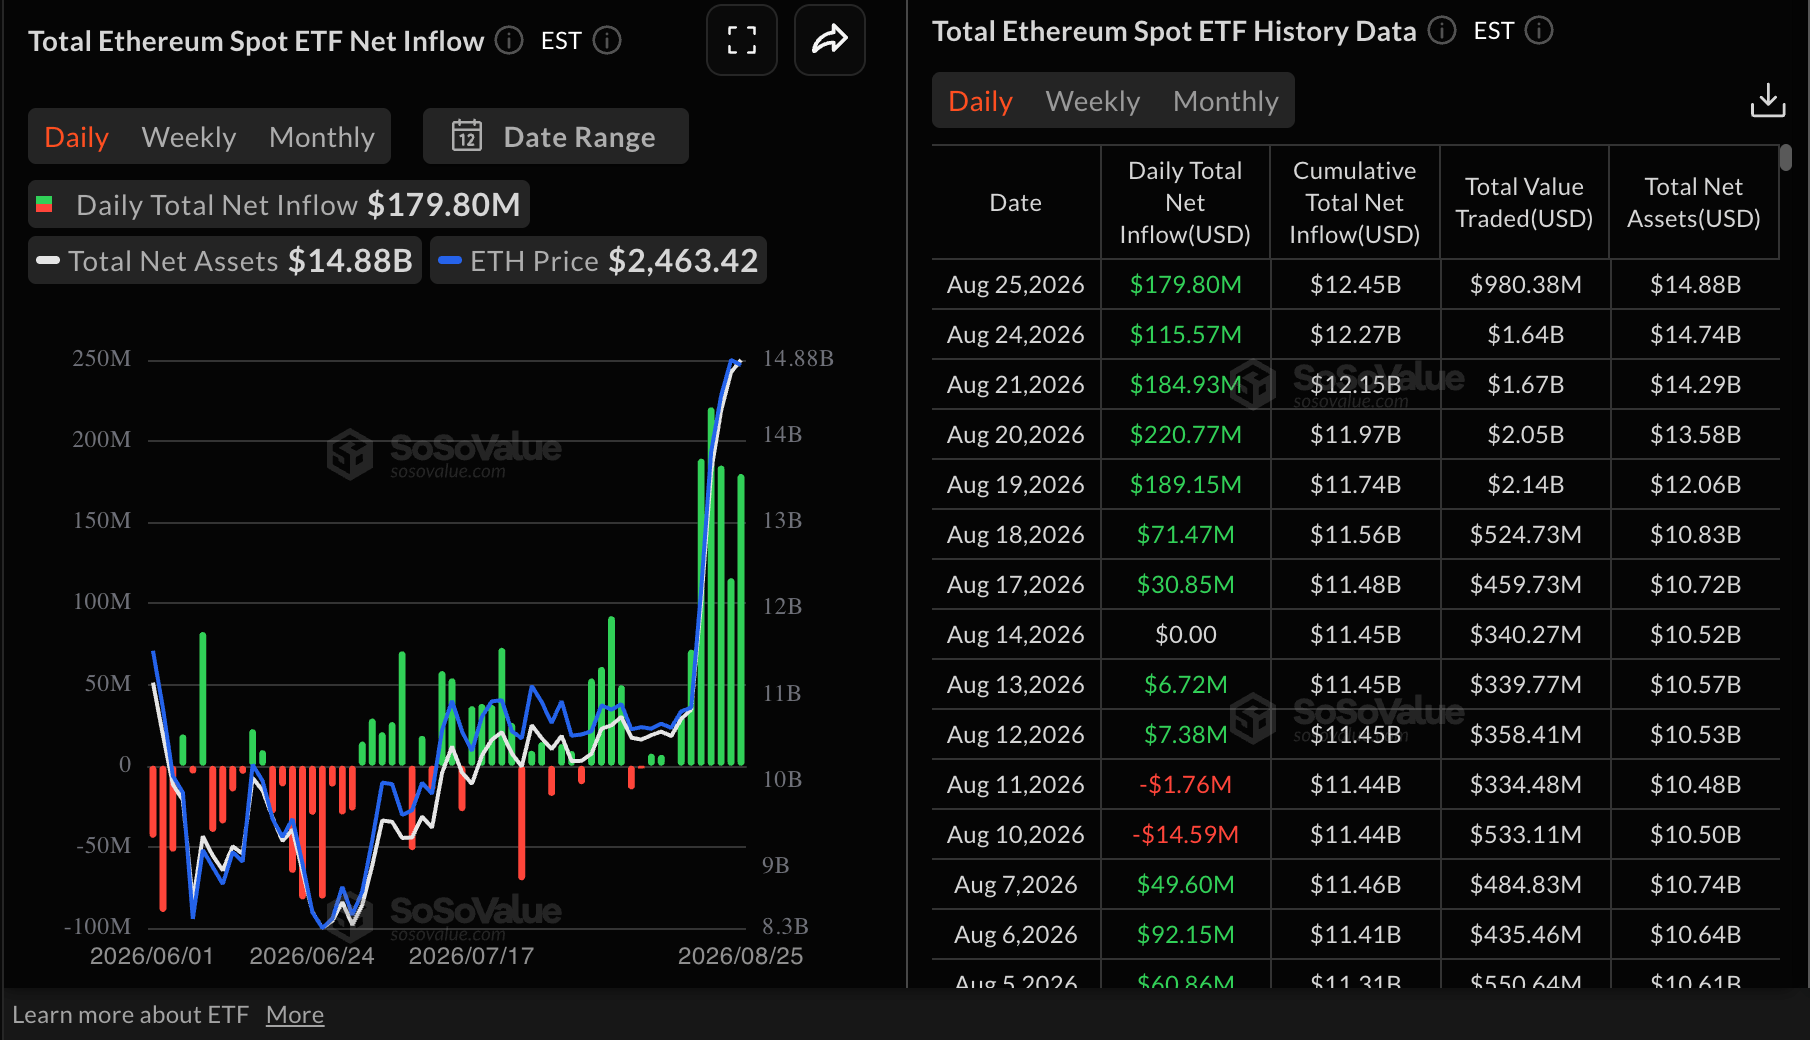
Ethereum remains largely in bullish hands, supported by steady spot ETF inflows. According to SoSoValue, US-listed ETFs attracted $180 million in inflows on Tuesday, increasing from $116 million the day before. If risk-on sentiment continues to grow, it could offset sell-side pressure from profit-taking activities and raise the odds of an extended breakout above $2,600.
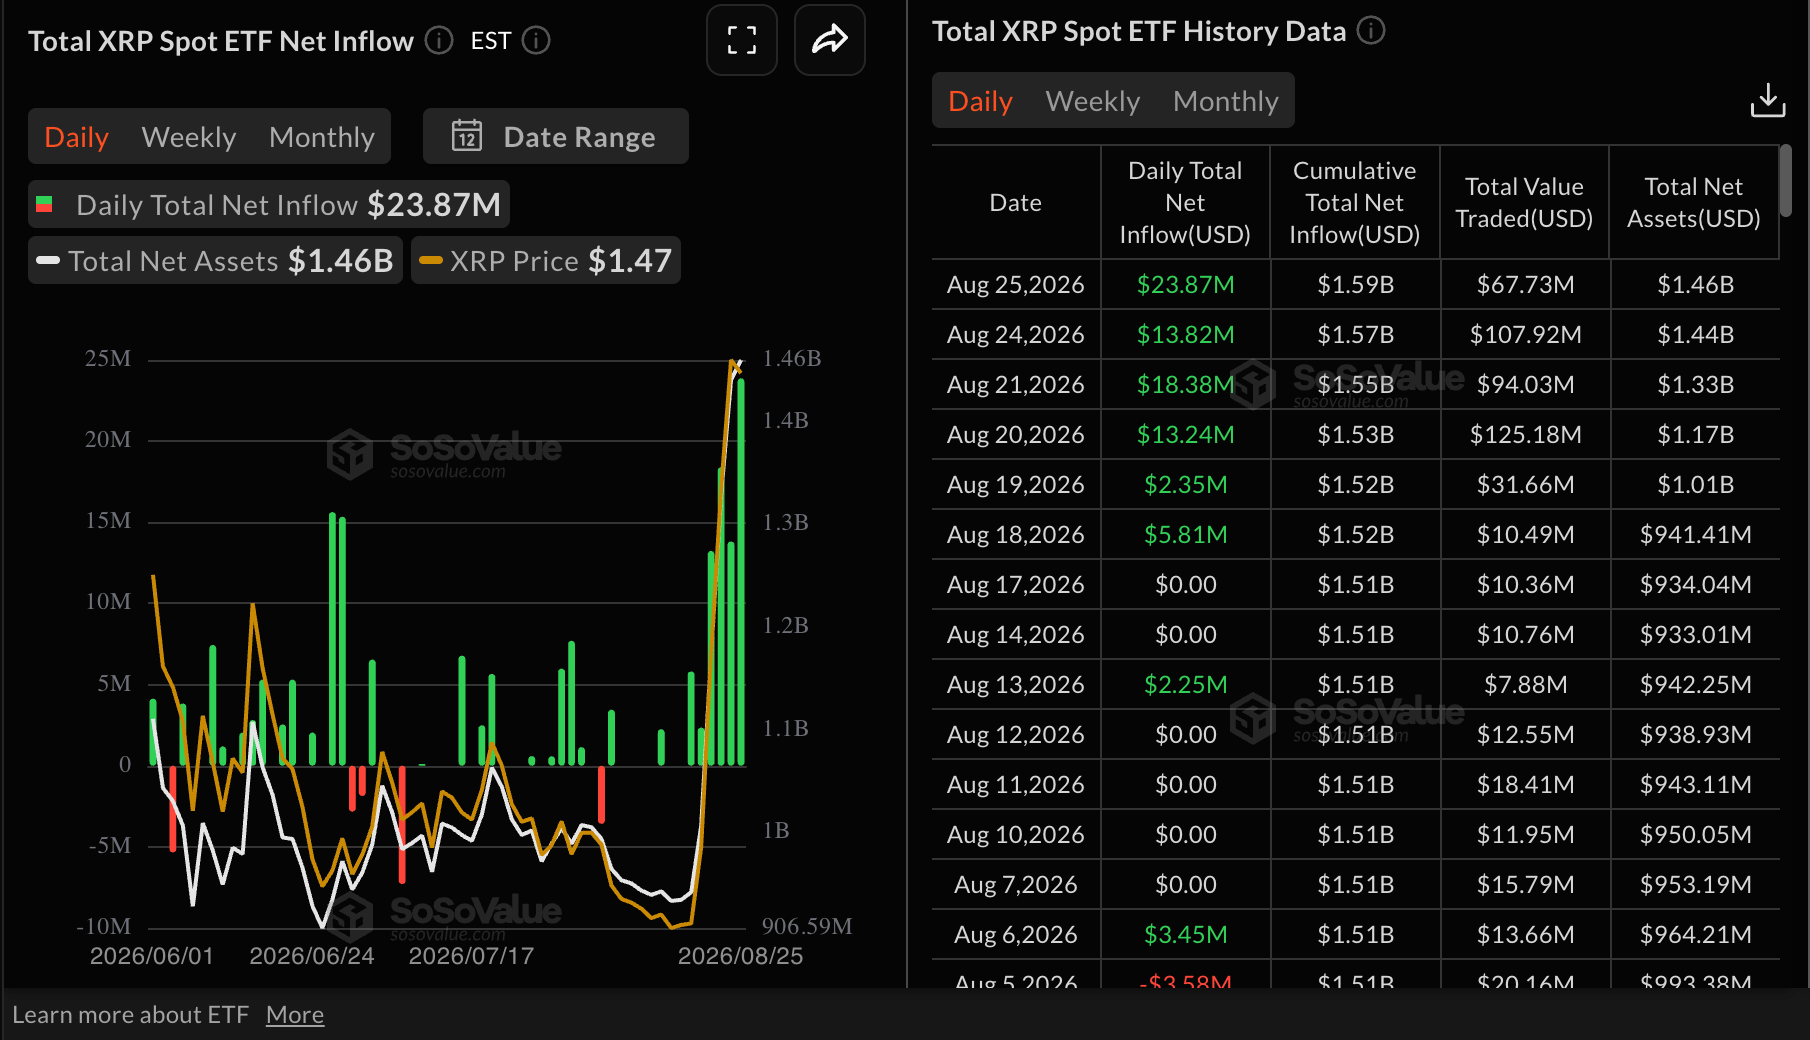
XRP’s spot ETFs are similarly gaining traction, as inflows climbed to $24 million on Tuesday, from $14 million the previous day. As a result, cumulative inflows have expanded to $1.59 billion, while net assets under management edged higher to $1.46 billion.
K33 Research highlighted in its weekly report that "market activity has also returned sharply, with BTC ETF inflows at their strongest since October 2025, spot and perp volumes up 188%, CME volumes up 152%, and CME’s annualized BTC basis reaching 11.1%. Bullish flows have clearly returned to the market."
Technical analysis: Bitcoin holds a bullish near-term bias
Bitcoin trades at $78,986, extending its advance well above the main Exponential Moving Averages (EMAs) and maintaining a clear bullish near-term bias. This outlook holds despite the rejection at $81,273.
Moreover, momentum remains strong, with the Moving Average Convergence Divergence (MACD) above zero and its latest reading elevated, while the Relative Strength Index (RSI) near 81 signals overbought conditions that could hint at consolidation or a corrective phase rather than an immediate trend reversal.
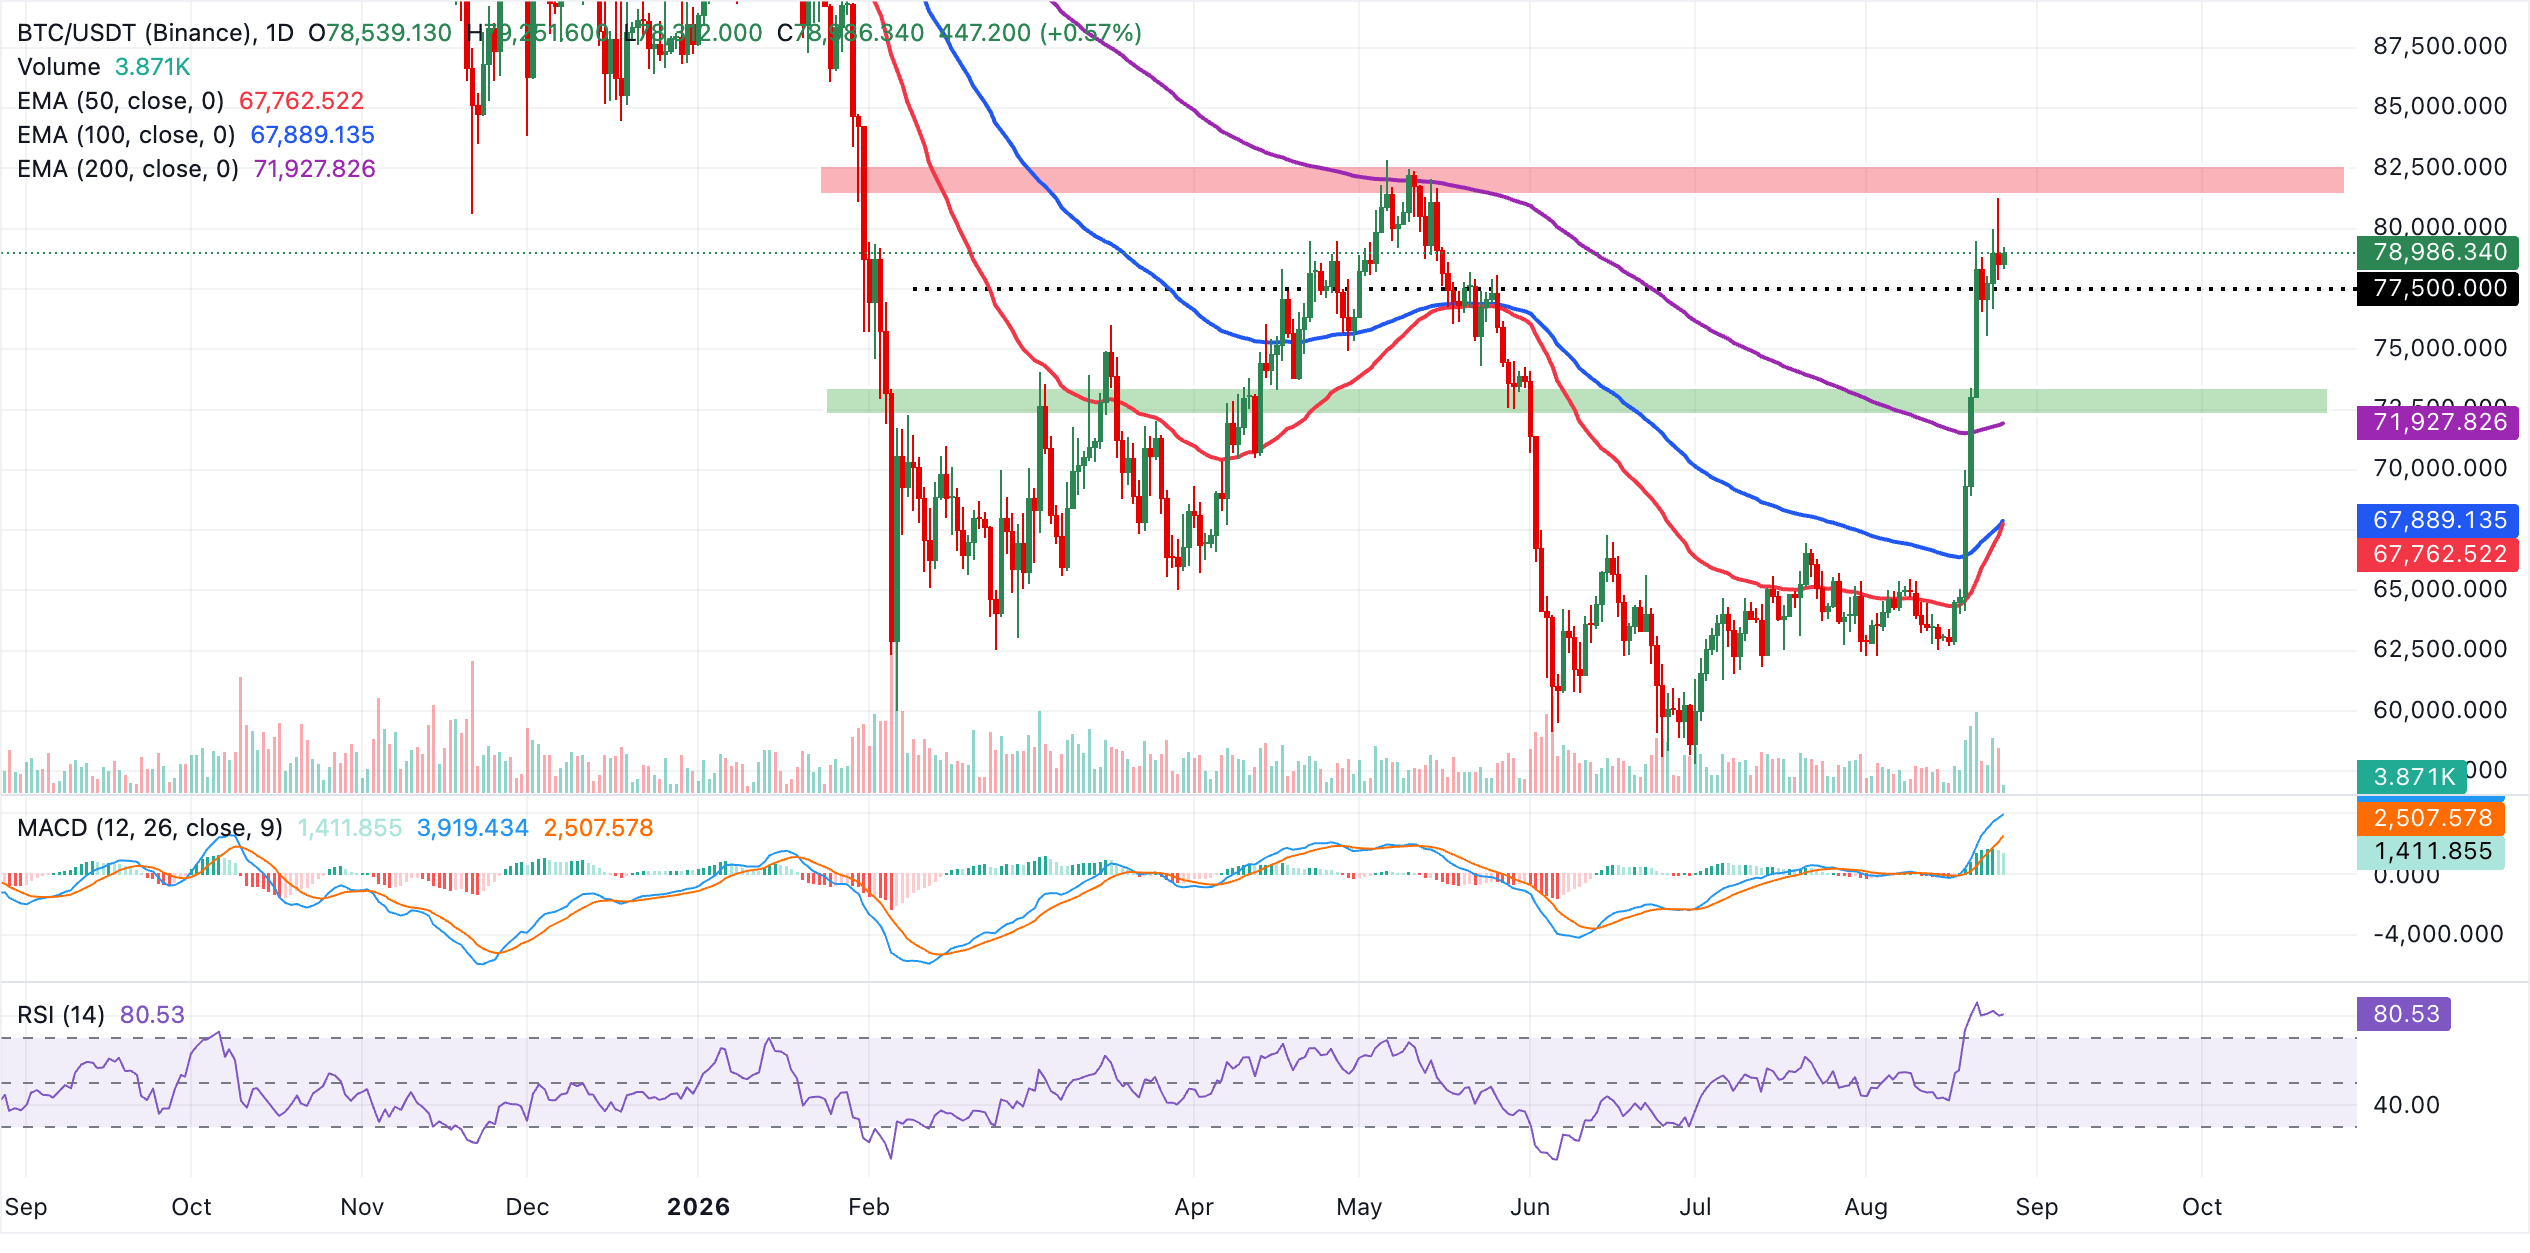
Immediate support hails from the current price area near $79,000, with a deeper, more structural demand zone emerging around the 200-day EMA at $71,928. Below that, the clustered 50-day and 100-day EMAs at $67,763 and $67,889 form a broader medium-term support band that should attract buyers on a more pronounced pullback.
As long as BTC stays above these moving average supports, the technical tone remains constructive for a sustained move above $80,000 and the subsequent hurdles at $82,500 and $84,000, respectively. Still, the overbought RSI warns that fresh upside may face more pauses and shakeouts before the trend resumes.
"Bitcoin has staged an unprecedented momentum shift, reclaiming its 50-day, 100-day, 200-day, and 200-week moving averages in just four days, a move that historically has only occurred near the start of cyclical bull markets," K33 Research explained. The report added that "while the daily RSI reached an extreme 85.9, historical data suggests such elevated readings have been associated with particularly strong forward returns rather than imminent weakness."
Altcoins technical outlook: Ethereum and XRP hold key support levels
Ethereum trades at $2,462, extending its advance well above the key moving averages, which keeps the near-term bias bullish. Momentum indicators reinforce the constructive tone, with the RSI hovering in overbought territory near 76. Moreover, the MACD remains positive, above its signal line, with a still-elevated histogram, suggesting buyers remain in control even if upside starts to lose steam.
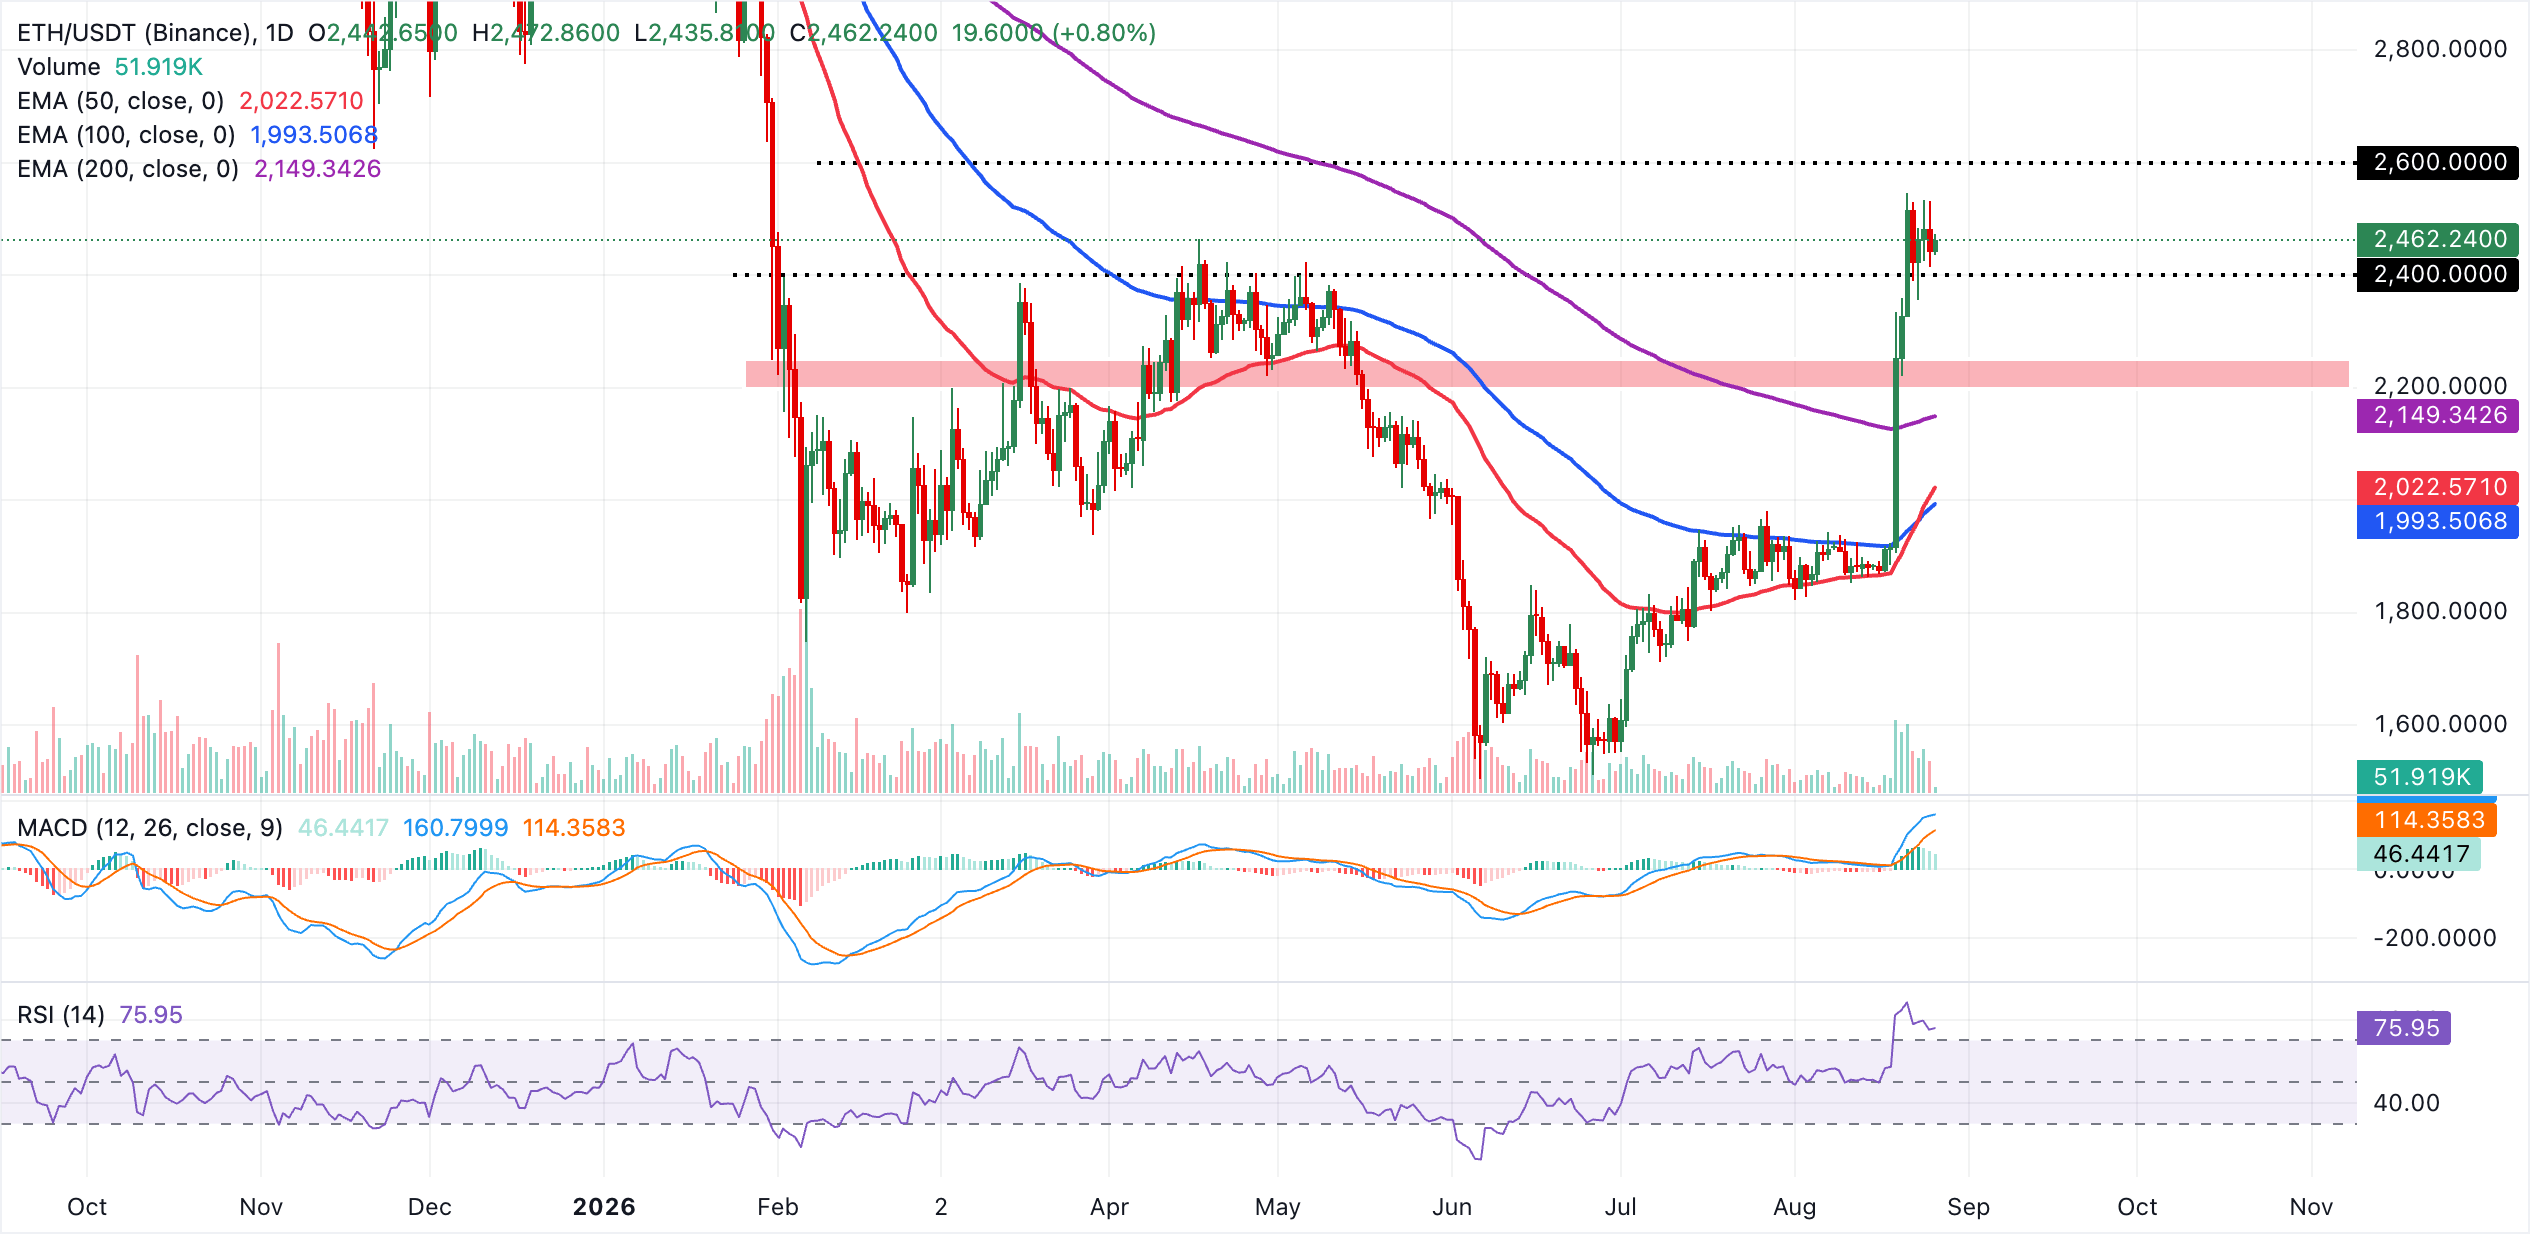
Initial support appears at the 200-day EMA at $2,149, where a pullback could find underlying demand before shorter-term trend gauges come into play. Below that, the 50-day EMA at $2,023 and the 100-day EMA at $1,994 form a broader support band that would be expected to attract dip-buying on a deeper correction. As long as ETH holds above these clustered EMAs, the broader technical structure favors further gains, with any consolidation likely to be treated as a pause within the prevailing bullish phase.
As for XRP, the spot price trades at $1.44, extending a bullish stance. The token holds well above the 50-day, 100-day and 200-day EMAs, preventing losses from last week's peak of $1.70 from persisting.
Meanwhile, the MACD remains firmly positive, with the line rising and reinforcing upside momentum, while the RSI near 74 is overbought, hinting at strong but stretched buying pressure.
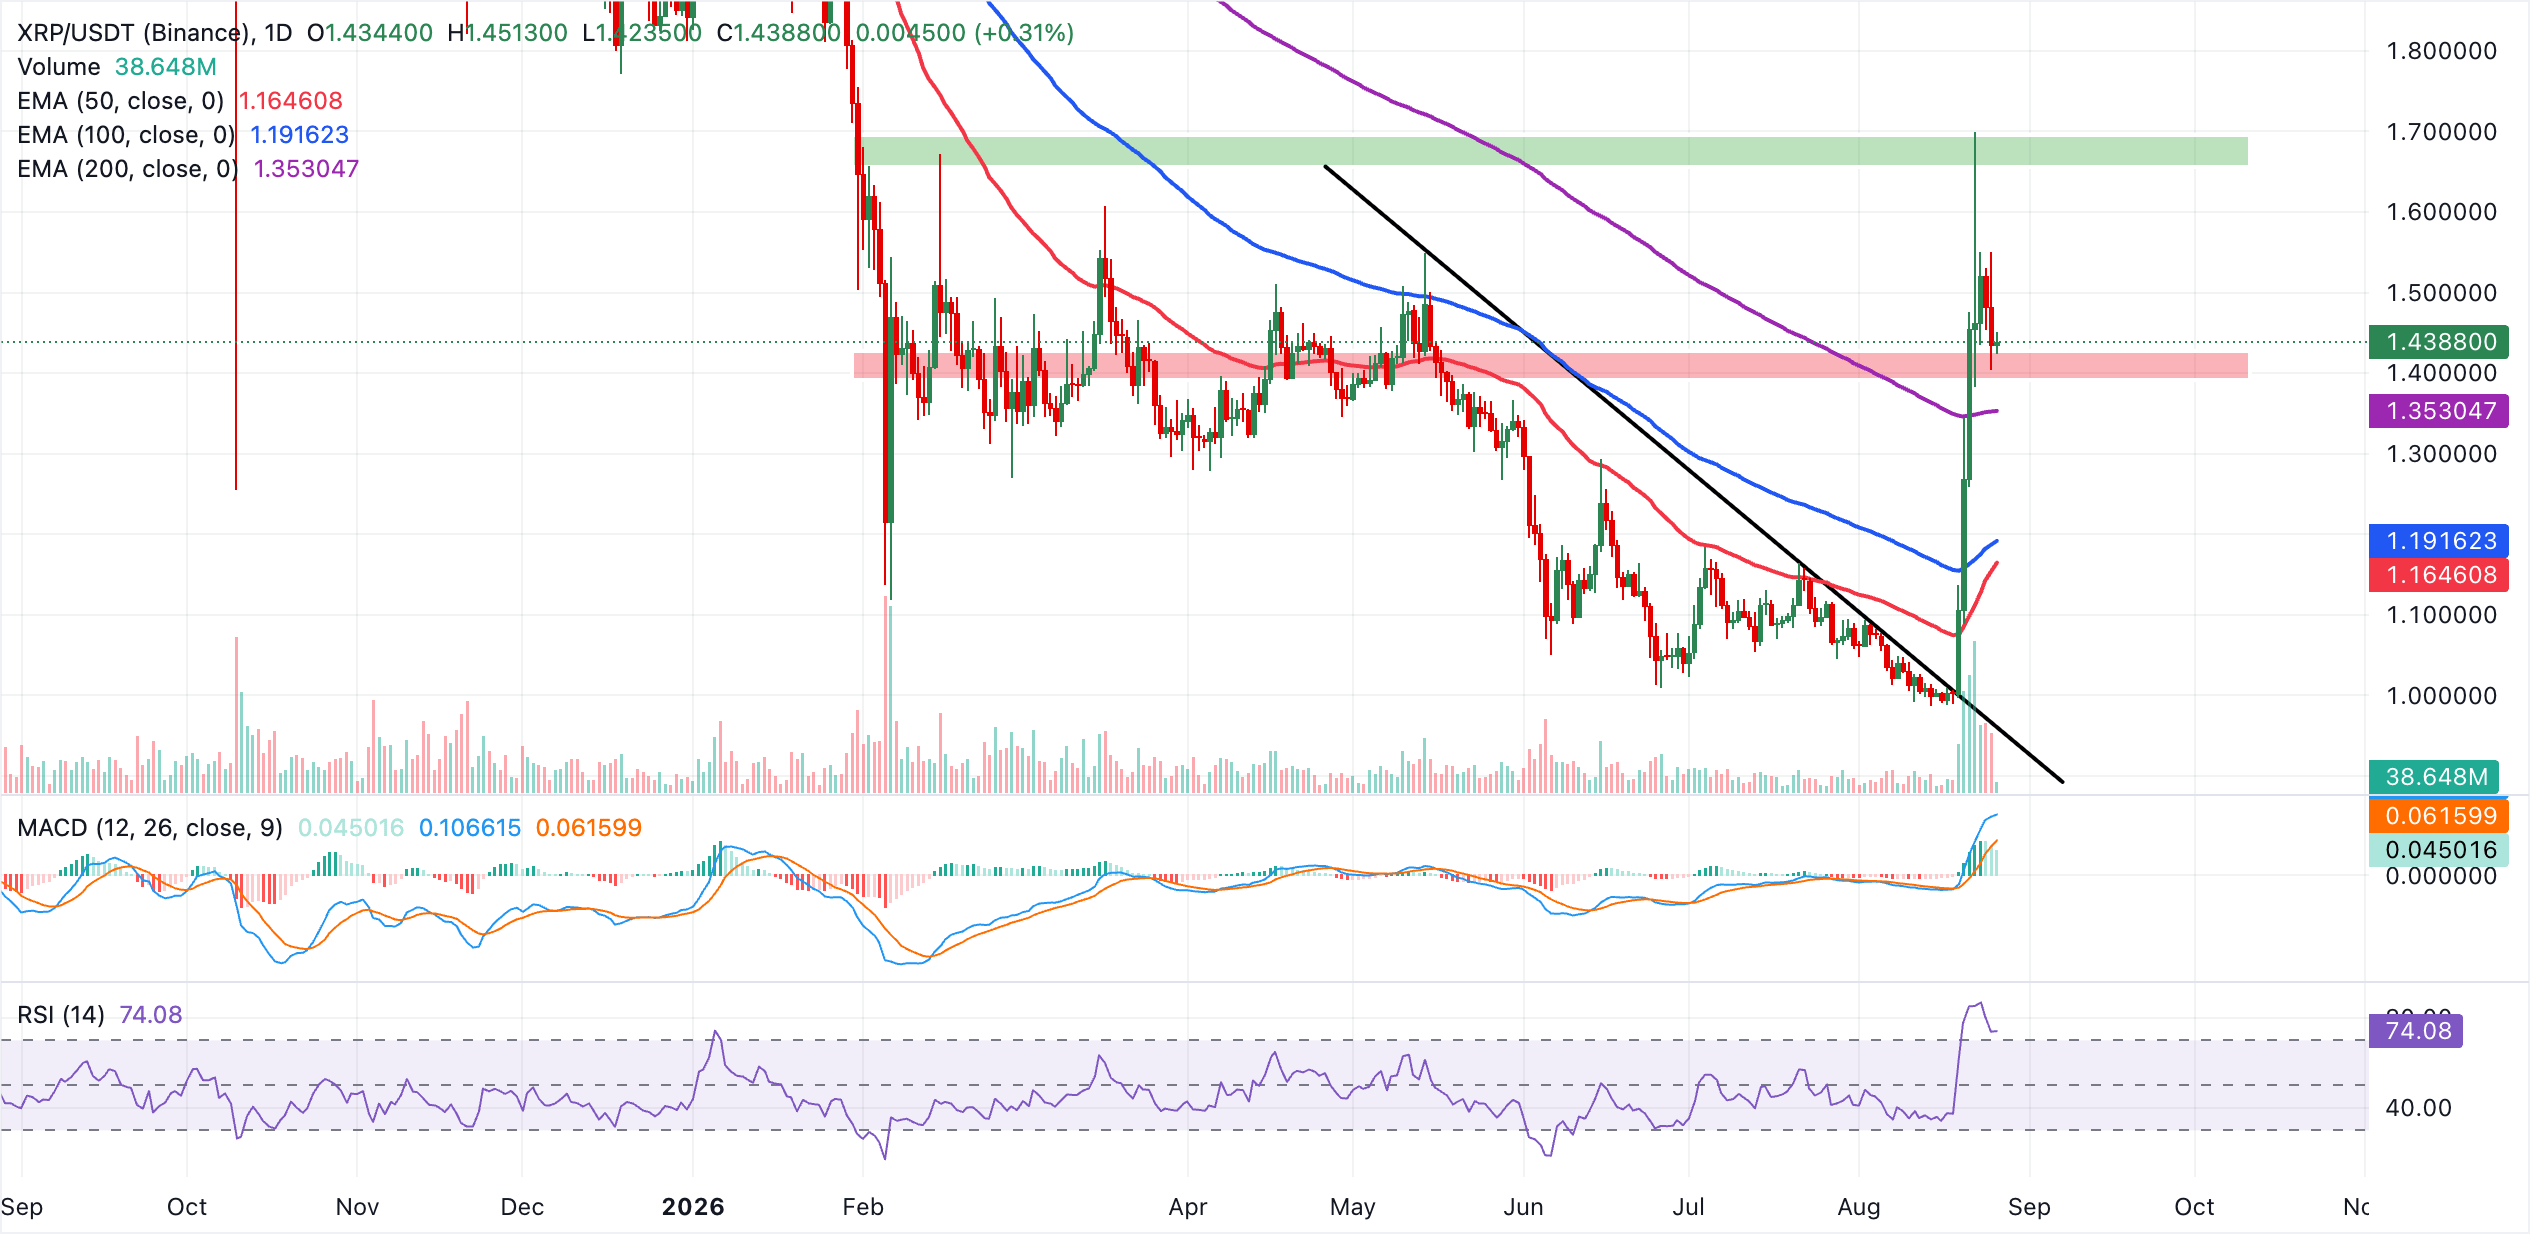
Initial support lies at the latest close area around $1.44, ahead of the 200-day EMA at $1.35, with deeper demand seen at the 100-day and 50-day EMAs at $1.19 and $1.16, where a pullback would likely attract dip-buying interest while the broader bullish structure remains intact. A steady increase in the token's value could break above $1.70, increasing the chances of the next major breakout past $2.00.
(The technical analysis of this story was written with the help of an AI tool. Know more.)
Crypto ETF FAQs
An Exchange-Traded Fund (ETF) is an investment vehicle or an index that tracks the price of an underlying asset. ETFs can not only track a single asset, but a group of assets and sectors. For example, a Bitcoin ETF tracks Bitcoin’s price. ETF is a tool used by investors to gain exposure to a certain asset.
Yes. The first Bitcoin futures ETF in the US was approved by the US Securities & Exchange Commission in October 2021. A total of seven Bitcoin futures ETFs have been approved, with more than 20 still waiting for the regulator’s permission. The SEC says that the cryptocurrency industry is new and subject to manipulation, which is why it has been delaying crypto-related futures ETFs for the last few years.
Yes. The SEC approved in January 2024 the listing and trading of several Bitcoin spot Exchange-Traded Funds, opening the door to institutional capital and mainstream investors to trade the main crypto currency. The decision was hailed by the industry as a game changer.
The main advantage of crypto ETFs is the possibility of gaining exposure to a cryptocurrency without ownership, reducing the risk and cost of holding the asset. Other pros are a lower learning curve and higher security for investors since ETFs take charge of securing the underlying asset holdings. As for the main drawbacks, the main one is that as an investor you can’t have direct ownership of the asset, or, as they say in crypto, “not your keys, not your coins.” Other disadvantages are higher costs associated with holding crypto since ETFs charge fees for active management. Finally, even though investing in ETFs reduces the risk of holding an asset, price swings in the underlying cryptocurrency are likely to be reflected in the investment vehicle too.
추천 기사


