


Stellar Price Forecast: XLM breaks above $0.20 as retail demand holds steady
- Stellar extends its recovery on Friday, trading above $0.20, supported by a steady increase in retail risk appetite.
- XLM derivatives see a massive surge in futures Open Interest to a yearly high of $292 million.
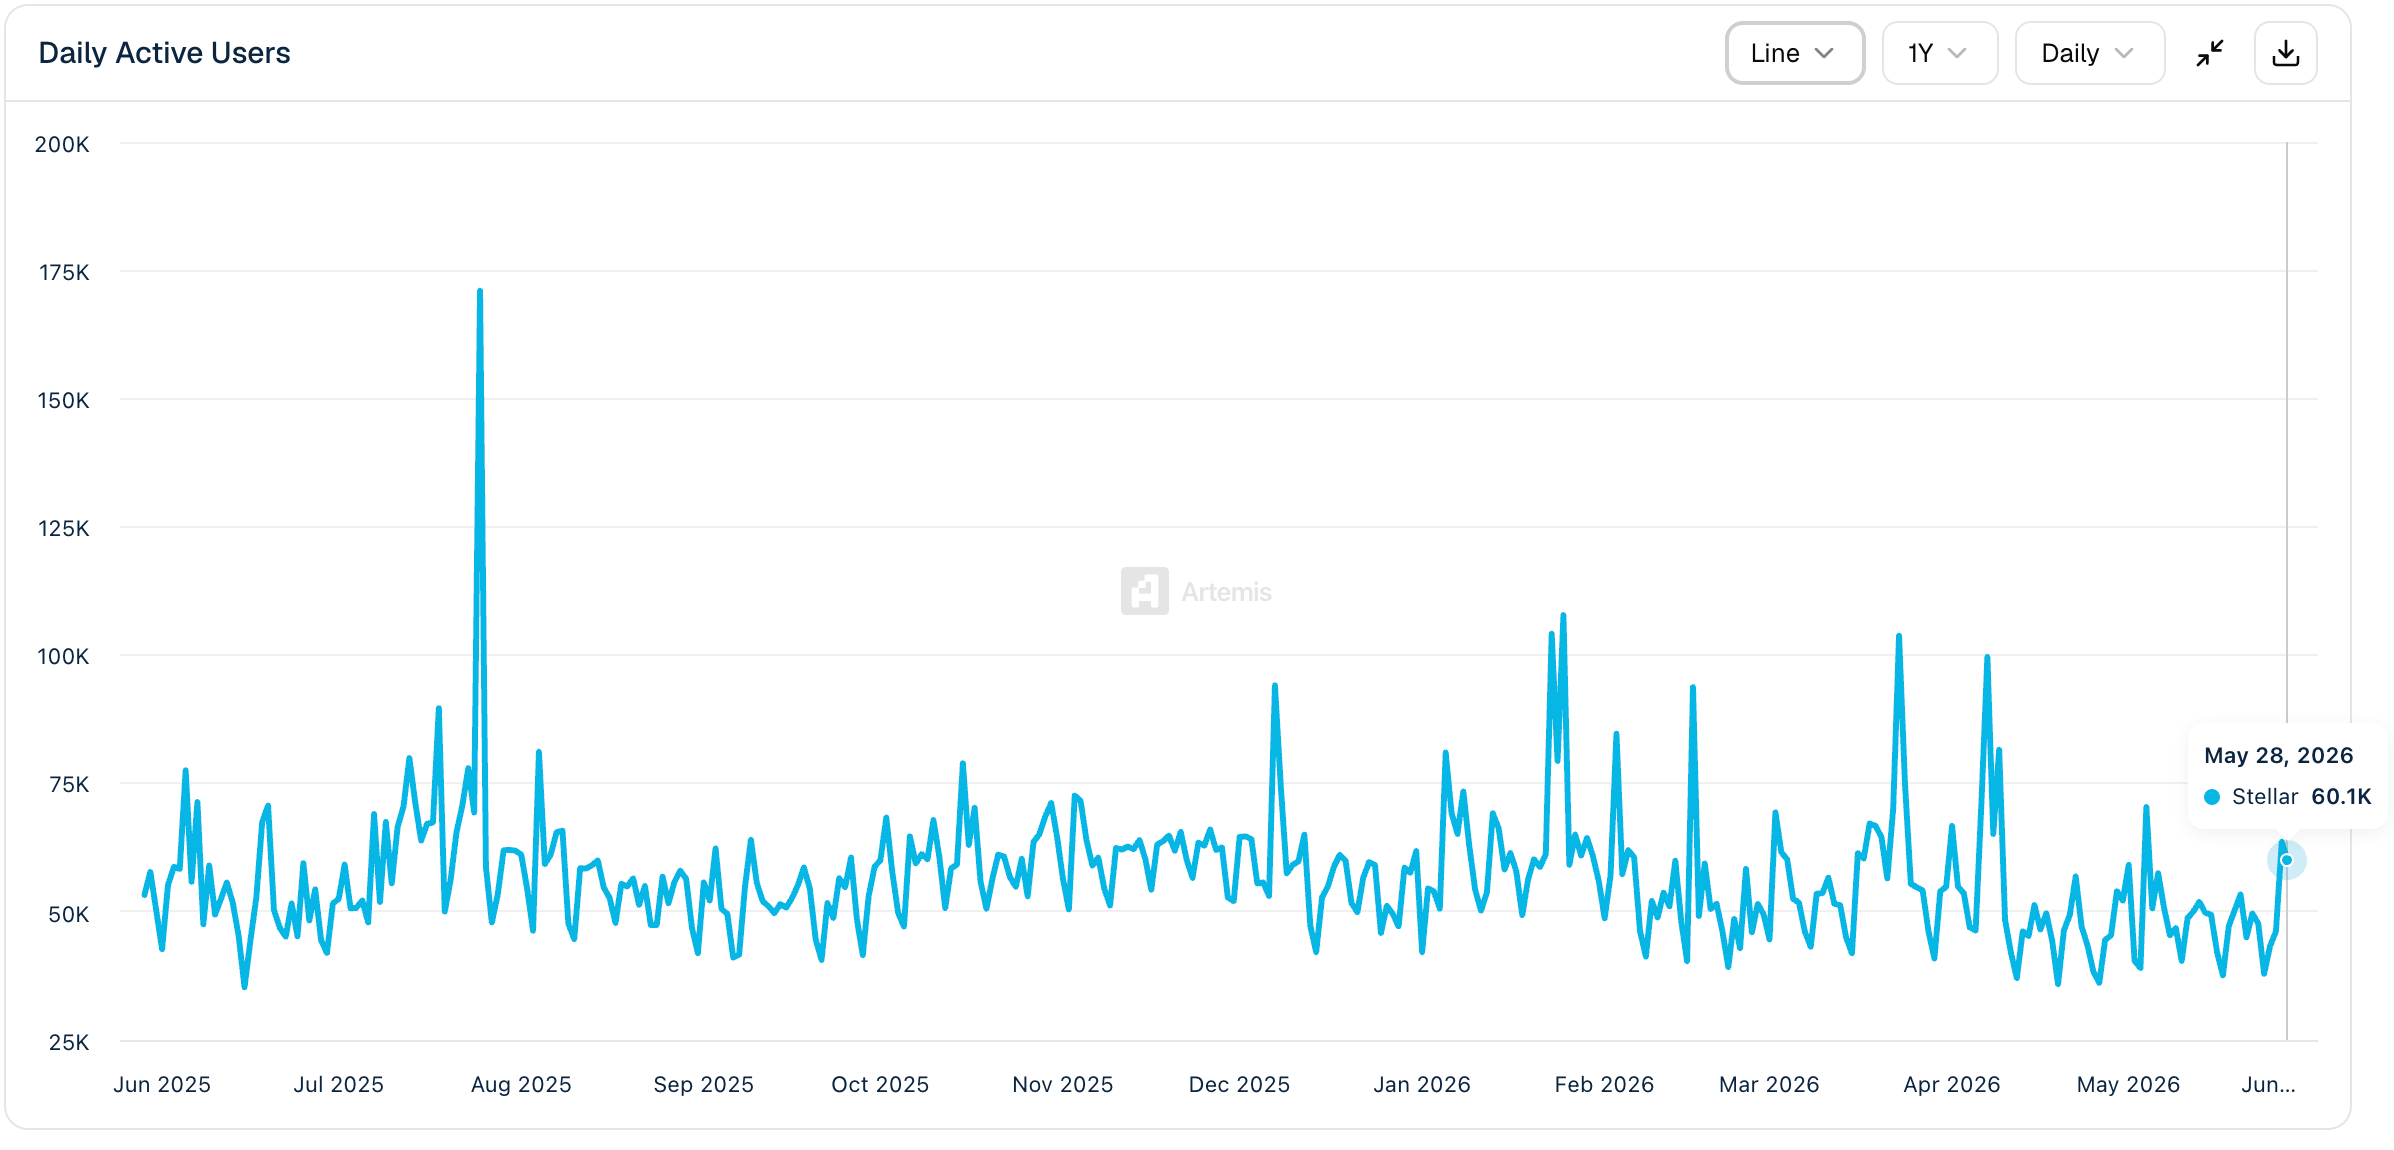
- Stellar’s daily active users remained elevated above 60,000 on Thursday despite a slight correction from weekly highs near 64,000.
Stellar (XLM) extends gains for a third consecutive day, riding above $0.2000 at the time of writing on Friday. The cross-border remittance token has gained traction despite lethargic sentiment in the broader cryptocurrency market, which has seen major digital assets such as Bitcoin (BTC) and Ethereum (ETH) trim gains from May highs.
Stellar holds firm amid strong on-chain activity
The Stellar network activity remains elevated with 60,000 active daily users on Friday, down slightly from nearly 64,000. According to Artemis on-chain data, the number of users actively transacting on the protocol by sending or receiving assets sharply increased from approximately 38,000 on Sunday, suggesting that risk-on sentiment is steadily growing. Should the Daily Active Users metric maintain its uptrend, demand for XLM could sustain the rally.
Meanwhile, demand for Stellar derivatives has been expanding this week, as reflected in the perpetual futures Open Interest (OI) exploding to $292 million on Friday, up from $155 million the day before. This surge indicates that retail traders are confident in XLM’s short to medium-term outlook and are willing to open new positions.
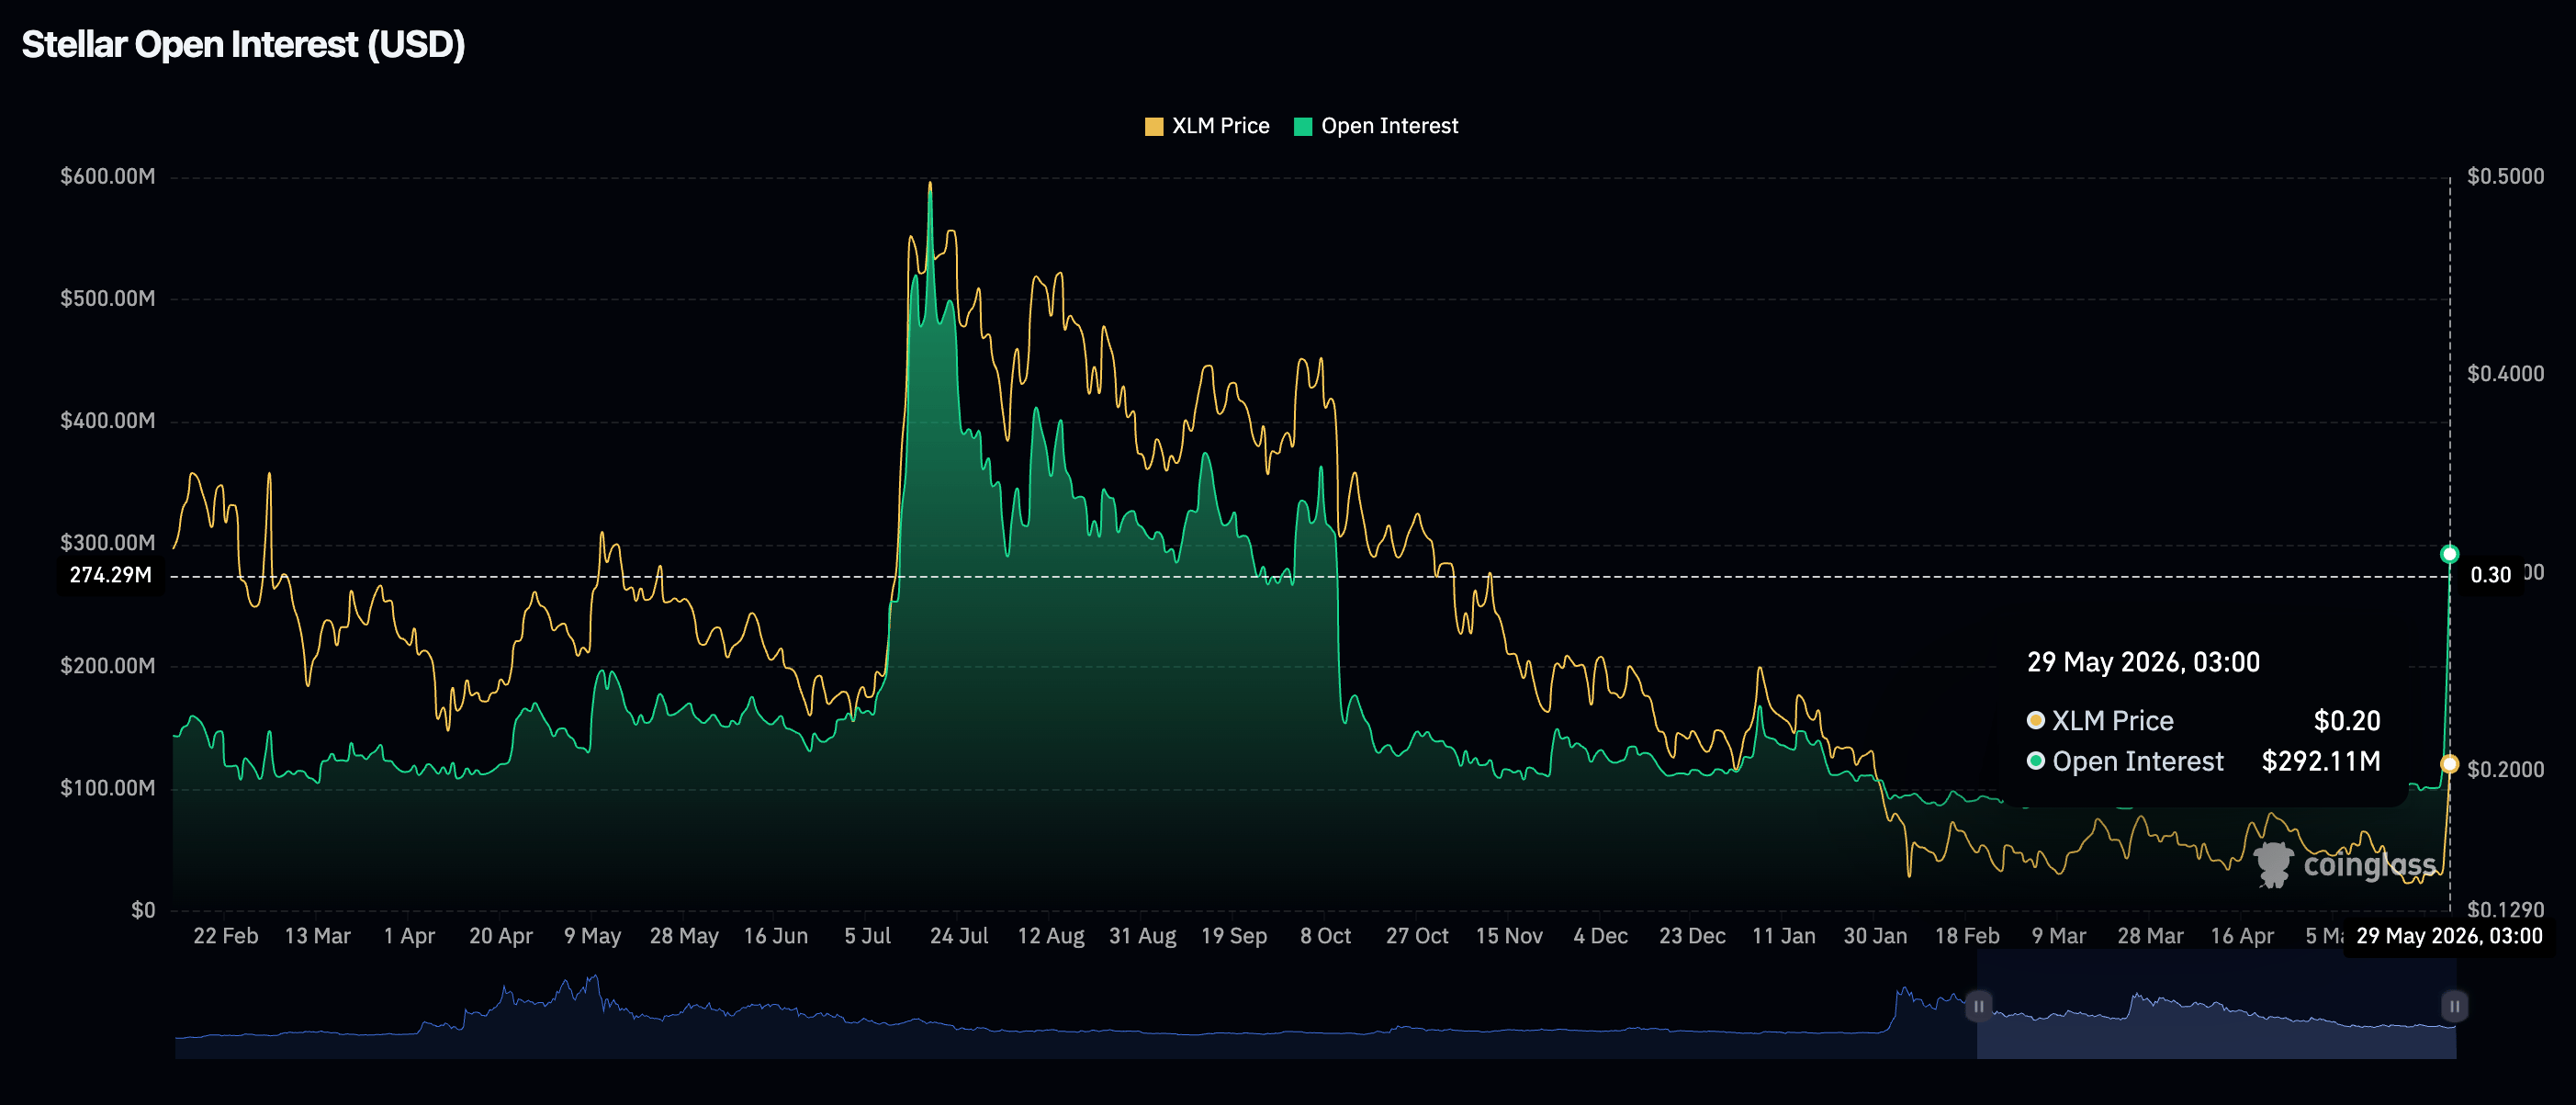
A sustained uptake of derivatives plays a critical role in supporting the bullish trend. However, if Stellar encounters a major supply and fails to break through, a correction could leave many traders liquidated, weighing significantly on sentiment.
Price analysis: Stellar sustains bullish outlook
Stellar trades above $0.2000, extending a strong bullish breakout and holding above a rising cluster of Exponential Moving Averages (EMAs), with the 200-day EMA now offering immediate dynamic support near $0.1973 and the 50-day and 100-day EMAs trailing lower.
Momentum indicators suggest robust but stretched upside momentum, with the spot price pressing along the upper Bollinger Band on the daily chart, the Relative Strength Index (RSI) holding deep in overbought territory around 77, while the Moving Average Convergence Divergence (MACD) histogram maintains a positive outlook.
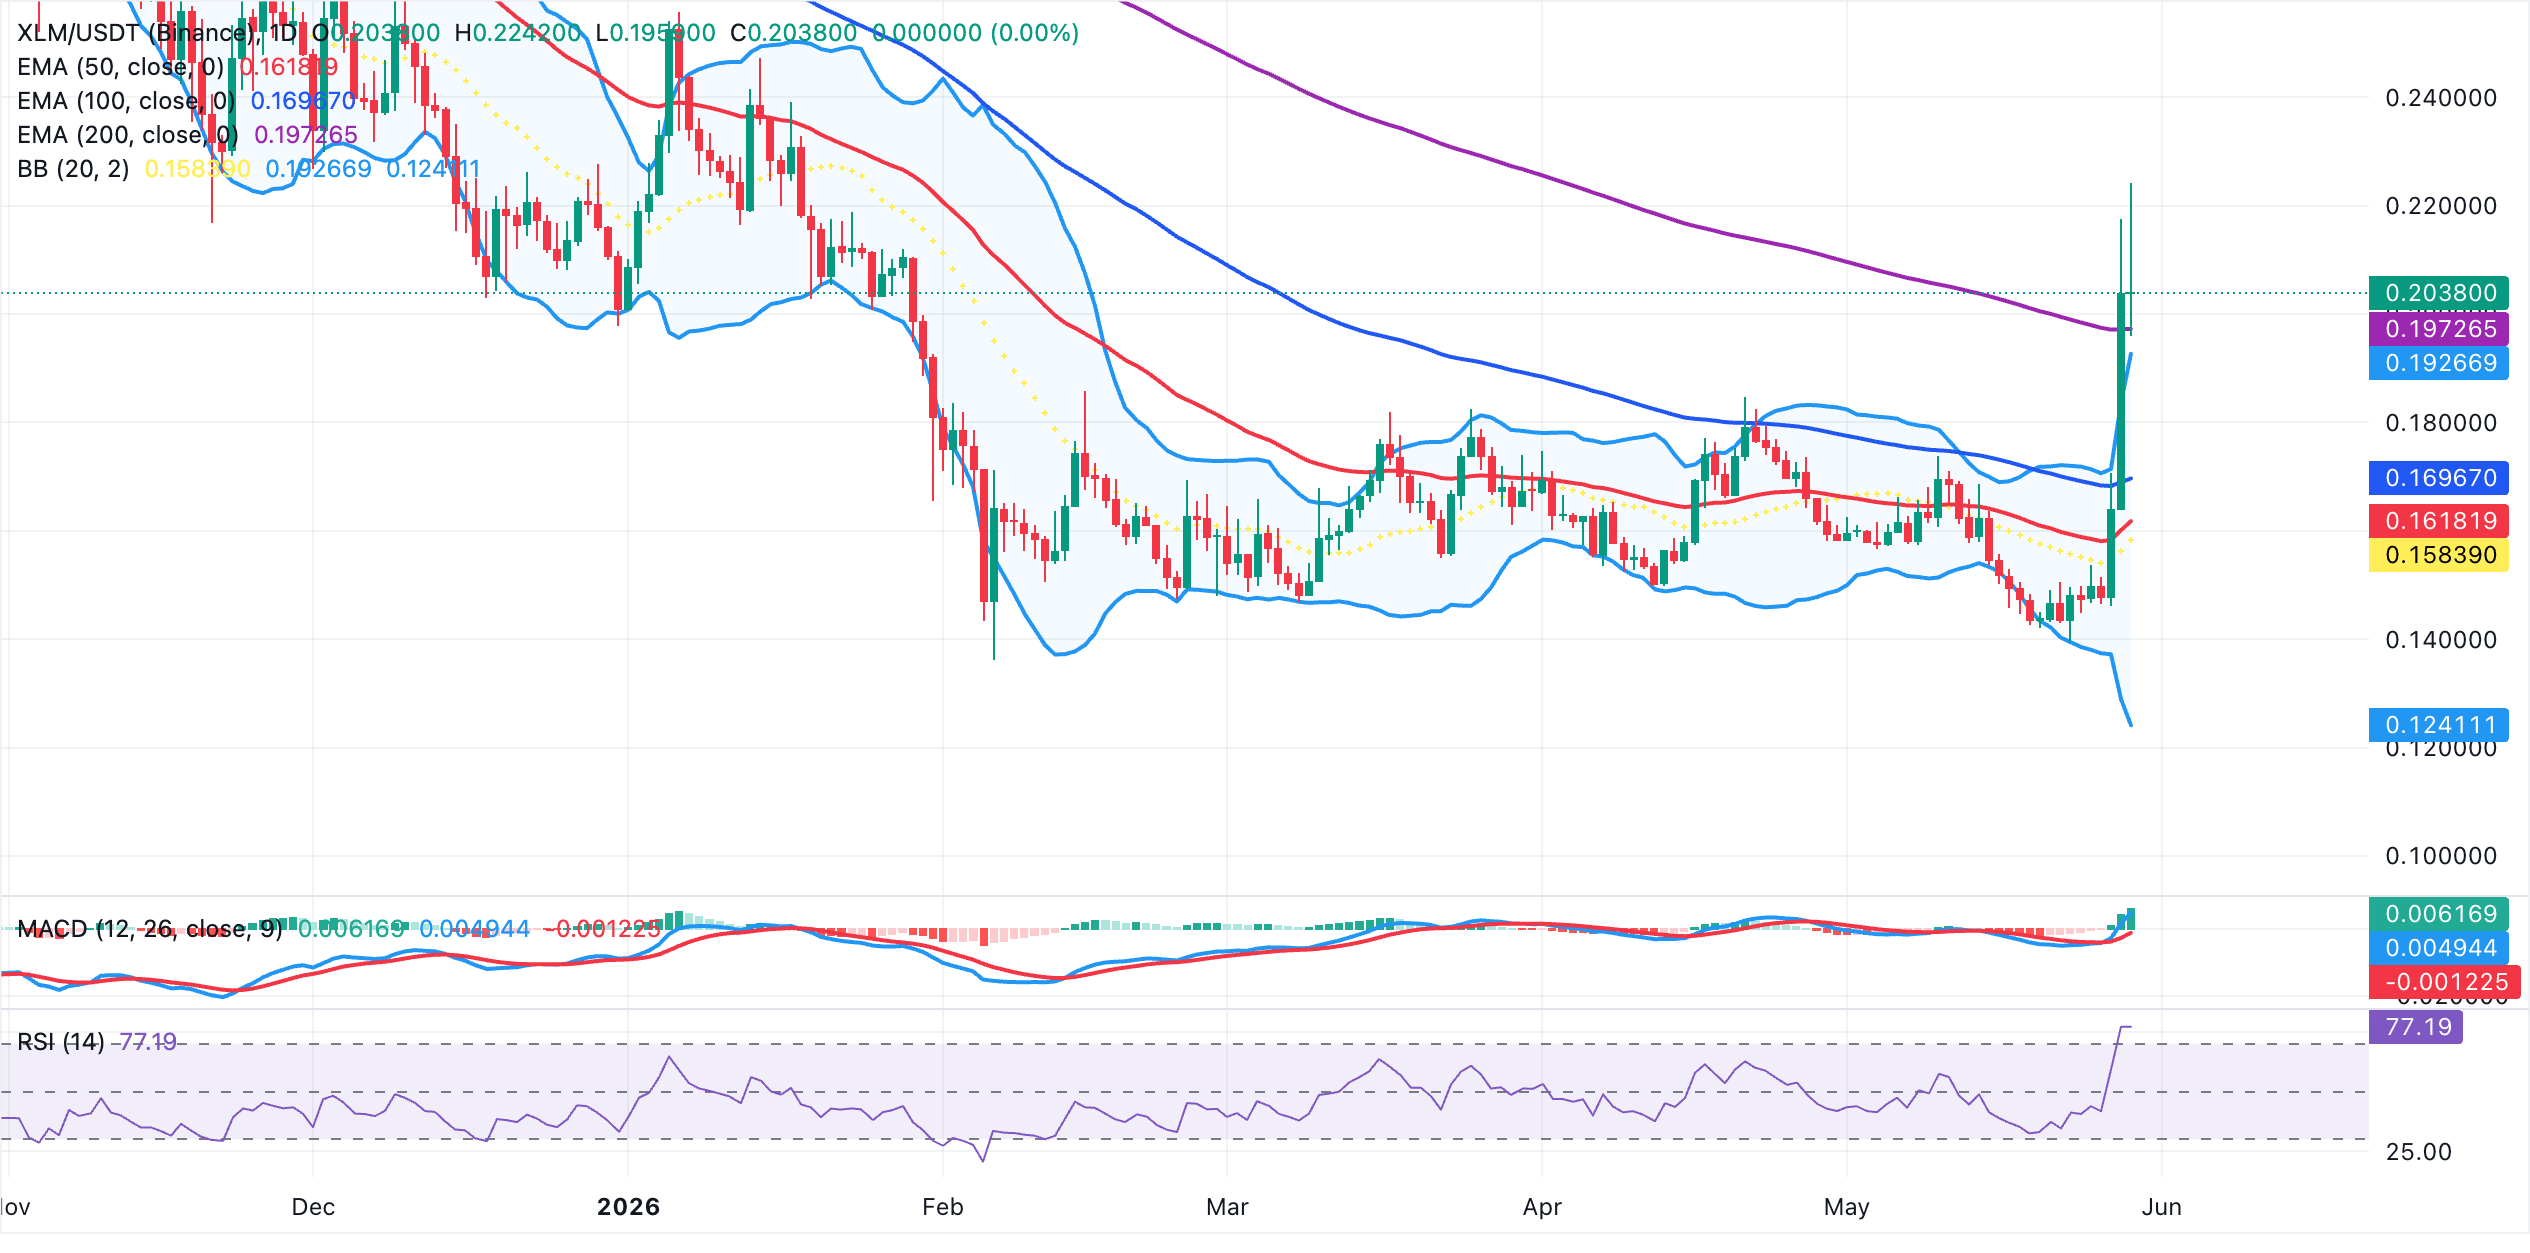
On the downside, initial support lies at the 200-day EMA at $0.1973, followed by the 100-day EMA near $0.1697 and the 50-day EMA around $0.1618. A deeper pullback would expose the Bollinger middle band, currently near $0.1584, before the lower band support down at $0.1241. With no immediate resistance levels based on the applied indicators, bulls retain control while price holds above the 200-day EMA. Still, the overbought RSI shows that a corrective phase back toward the key support levels would not be surprising.
(The technical analysis of this story was written with the help of an AI tool.)
Open Interest, funding rate FAQs
Higher Open Interest is associated with higher liquidity and new capital inflow to the market. This is considered the equivalent of increase in efficiency and the ongoing trend continues. When Open Interest decreases, it is considered a sign of liquidation in the market, investors are leaving and the overall demand for an asset is on a decline, fueling a bearish sentiment among investors.
Funding fees bridge the difference between spot prices and prices of futures contracts of an asset by increasing liquidation risks faced by traders. A consistently high and positive funding rate implies there is a bullish sentiment among market participants and there is an expectation of a price hike. A consistently negative funding rate for an asset implies a bearish sentiment, indicating that traders expect the cryptocurrency’s price to fall and a bearish trend reversal is likely to occur.
추천 기사


