


Crypto Overview: Trump mulls over Iran ceasefire extension – Stellar, Hyperliquid shine
- Bitcoin hovers above $73,000 on Friday, extending its fourth consecutive day of losses.
- The broader crypto market remains under pressure as Trump mulls over the US-Iran ceasefire extension.
- Stellar and Hyperliquid emerge as top performers over the last 24 hours.
Bitcoin (BTC) edges below $73,500 at press time on Friday, as the delay in the US-Iran ceasefire extension weighs down on the broader crypto market. The waning institutional backing in Bitcoin risks a third consecutive week with over $1 billion in outflows, while altcoins, Stellar (XLM) and Hyperliquid (HYPE), emerge as top performers over the last 24 hours.
Institutions trim Bitcoin exposure as Trump mulls over ceasefire renewal
Bitcoin risks slipping below $73,000 on Friday amid declining institutional support. So far this week, SoSoValue data shows that Bitcoin Exchange-Traded Funds (ETFs) recorded $1 billion in outflows over the last four days. An outflow on Friday would confirm a third consecutive week with over $1 billion in outflows, reaffirming a strategic capital restructuring away from Bitcoin.
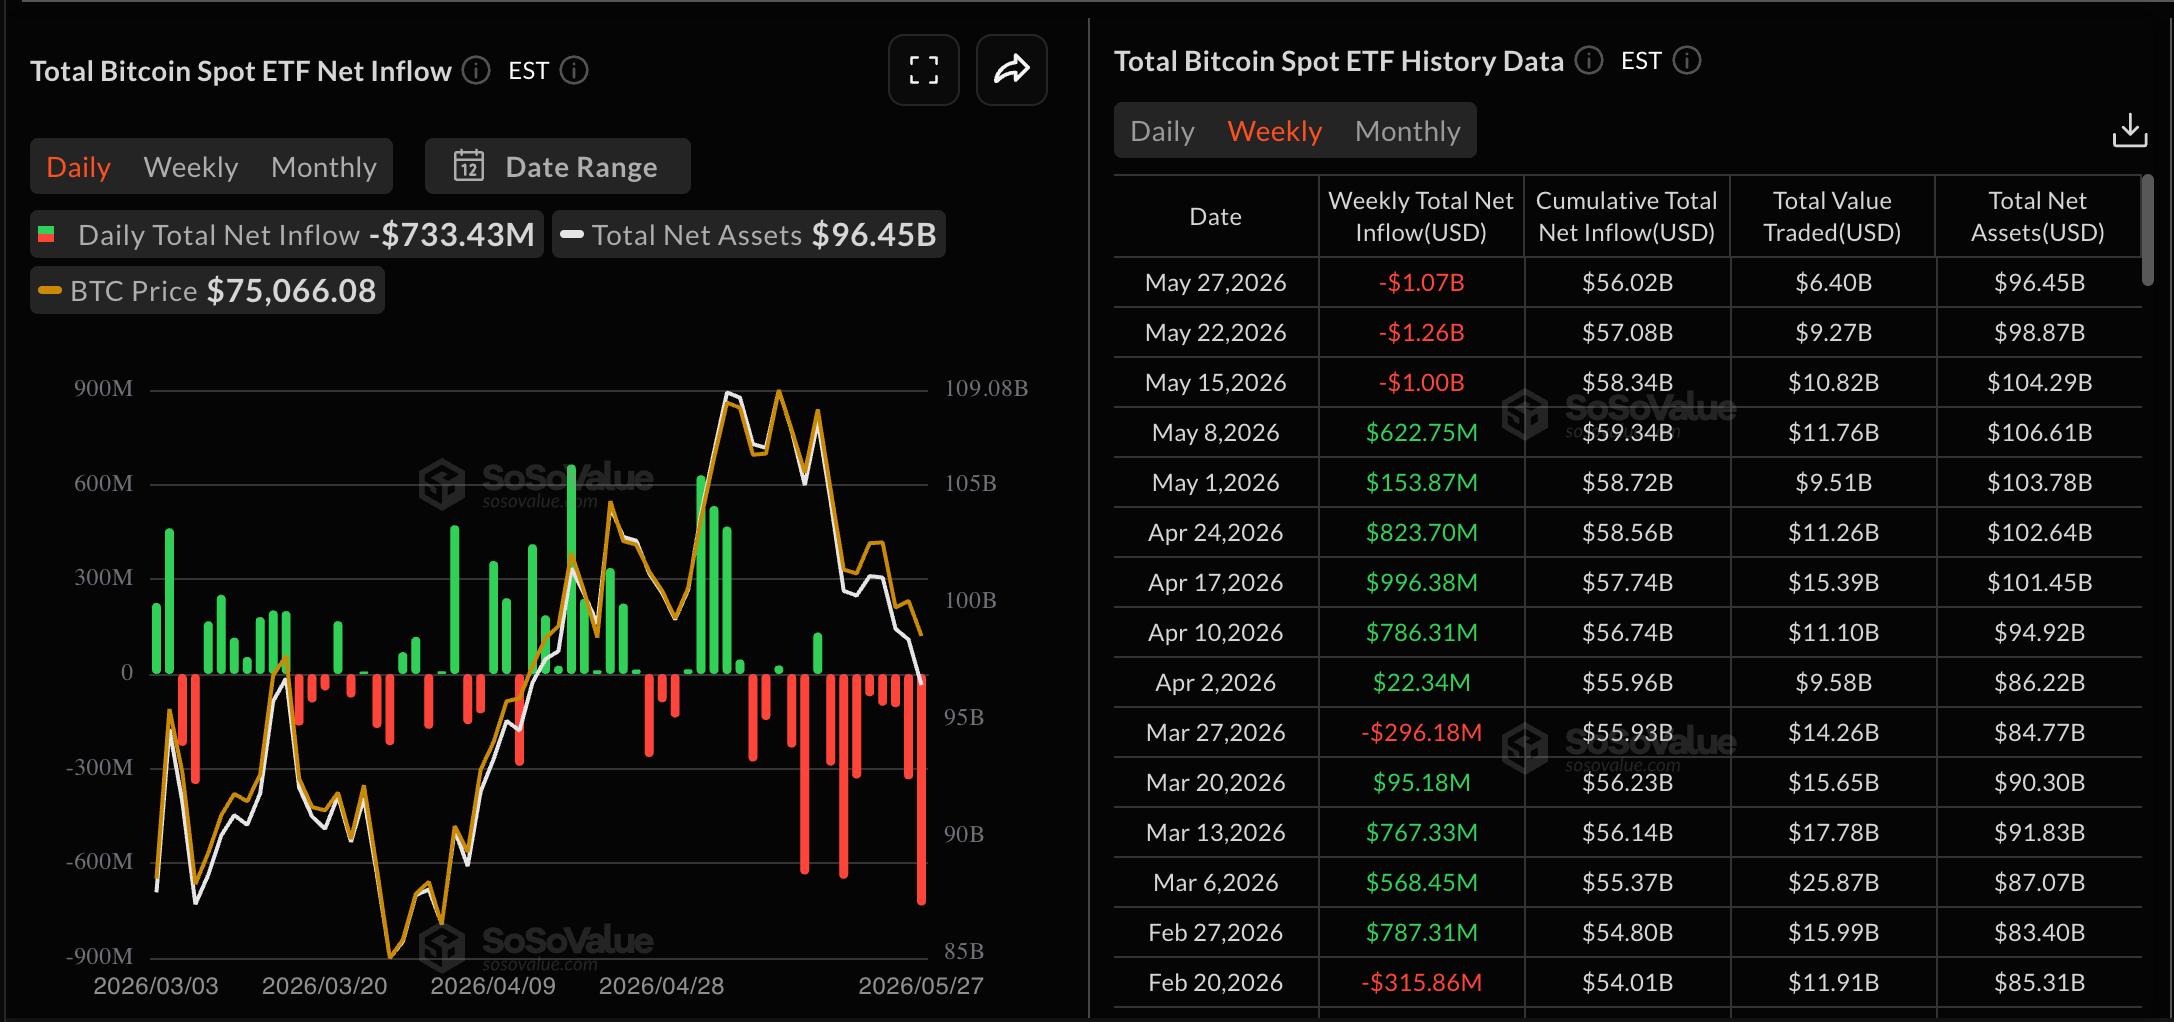
The looming geopolitical risk in the Middle East weakens the institutional confidence in high-risk assets such as Bitcoin. US President Donald Trump is pondering a 60-day ceasefire renewal with Iran, which is reported to include nuclear negotiations but no reopening of the Strait of Hormuz.
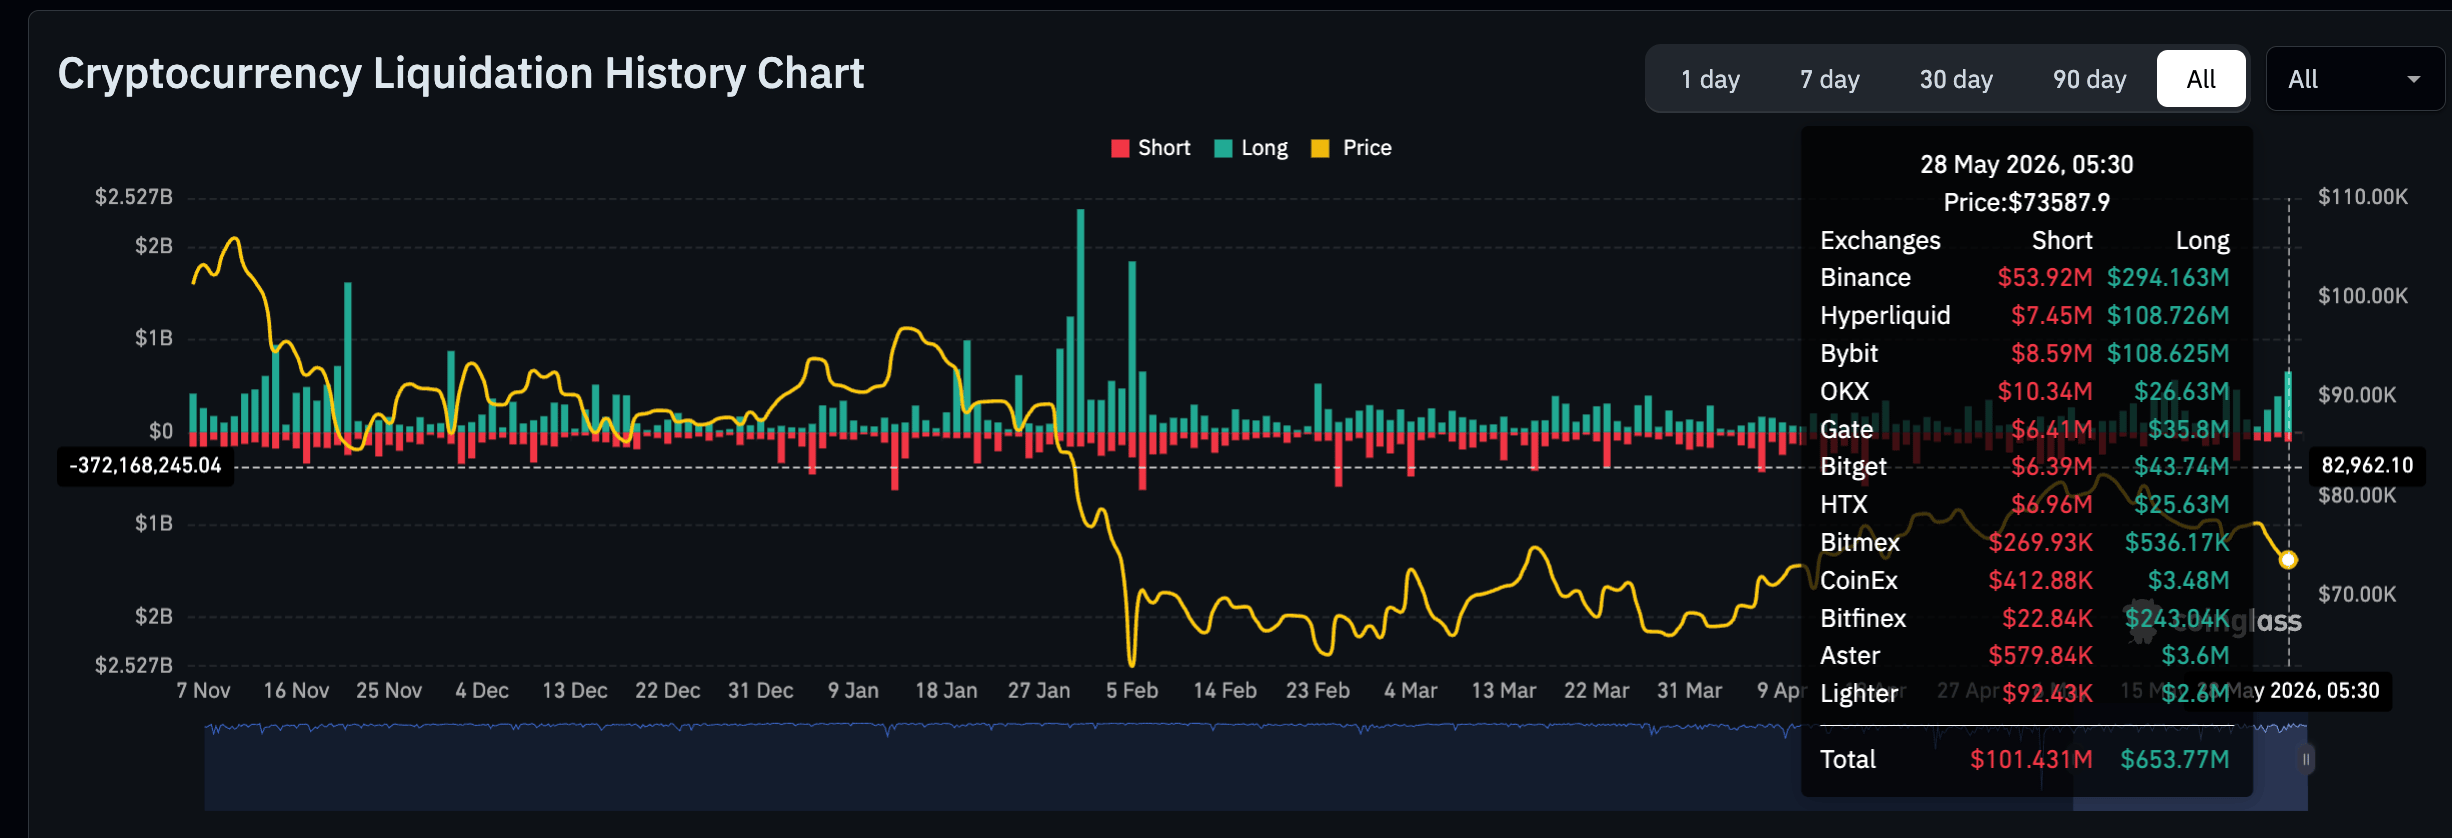
Crypto and Asian markets are pricing in the delay in the US-Iran ceasefire amid the risk of renewed strikes. Long liquidations of over $653 million on Thursday marked the largest liquidation event since February 6, implying underlying weakness among investors.
Technical outlook: Will Stellar and Hyperliquid extend gains?
Stellar edges below $0.2000 at press time on Friday, edging below after a 24% rally the previous day. XLM extends a strong bullish phase but is pressing against the 200-day Exponential Moving Average (EMA) at $0.1985, while holding well above the 50- and 100-day EMAs at $0.1616 and $0.1701, respectively, underscoring a constructive near-term bias.
Momentum backs the rally, testing its longer-term trend barrier, with the Moving Average Convergence Divergence (MACD) advancing into the positive territory, while the Relative Strength Index (RSI) around 71 shows overbought conditions that hint at a risk of consolidation or a pullback if the 200-day EMA continues to cap gains.
A clear daily close above the 200-day EMA at $0.1985 would open the door for further recovery, turning that level into the first reference point for bulls to defend on any subsequent dip. The path of least resistance for XLM targets the $0.2579 level, marked by the November 5 low.
Looking down, the initial support is seen at the 100-day EMA near $0.1701, with the 50-day EMA at $0.1616 reinforcing a deeper demand zone should profit-taking accelerate from current overbought readings.
Hyperliquid hovers above $60 at the time of writing on Friday, retaining a bullish near-term bias as price holds well above the 50-, 100-, and 200-day EMAs clustered between roughly $39.45 and $47.26, suggesting a firmly supported uptrend. The exchange token trades close to its all-time high of $64.48, which serves as the short-term barrier.
A daily close above this zone would push HYPE into price discovery mode, potentially targeting the 127.2% Fibonacci extension level at $70.04, measured from $59.45 to $20.51.
Momentum indicates a moderating pace of upside rather than outright exhaustion as the RSI at 68 hints at stretched but still constructive momentum, while the MACD and signal line shift sideways, resulting in a contraction in positive histogram.
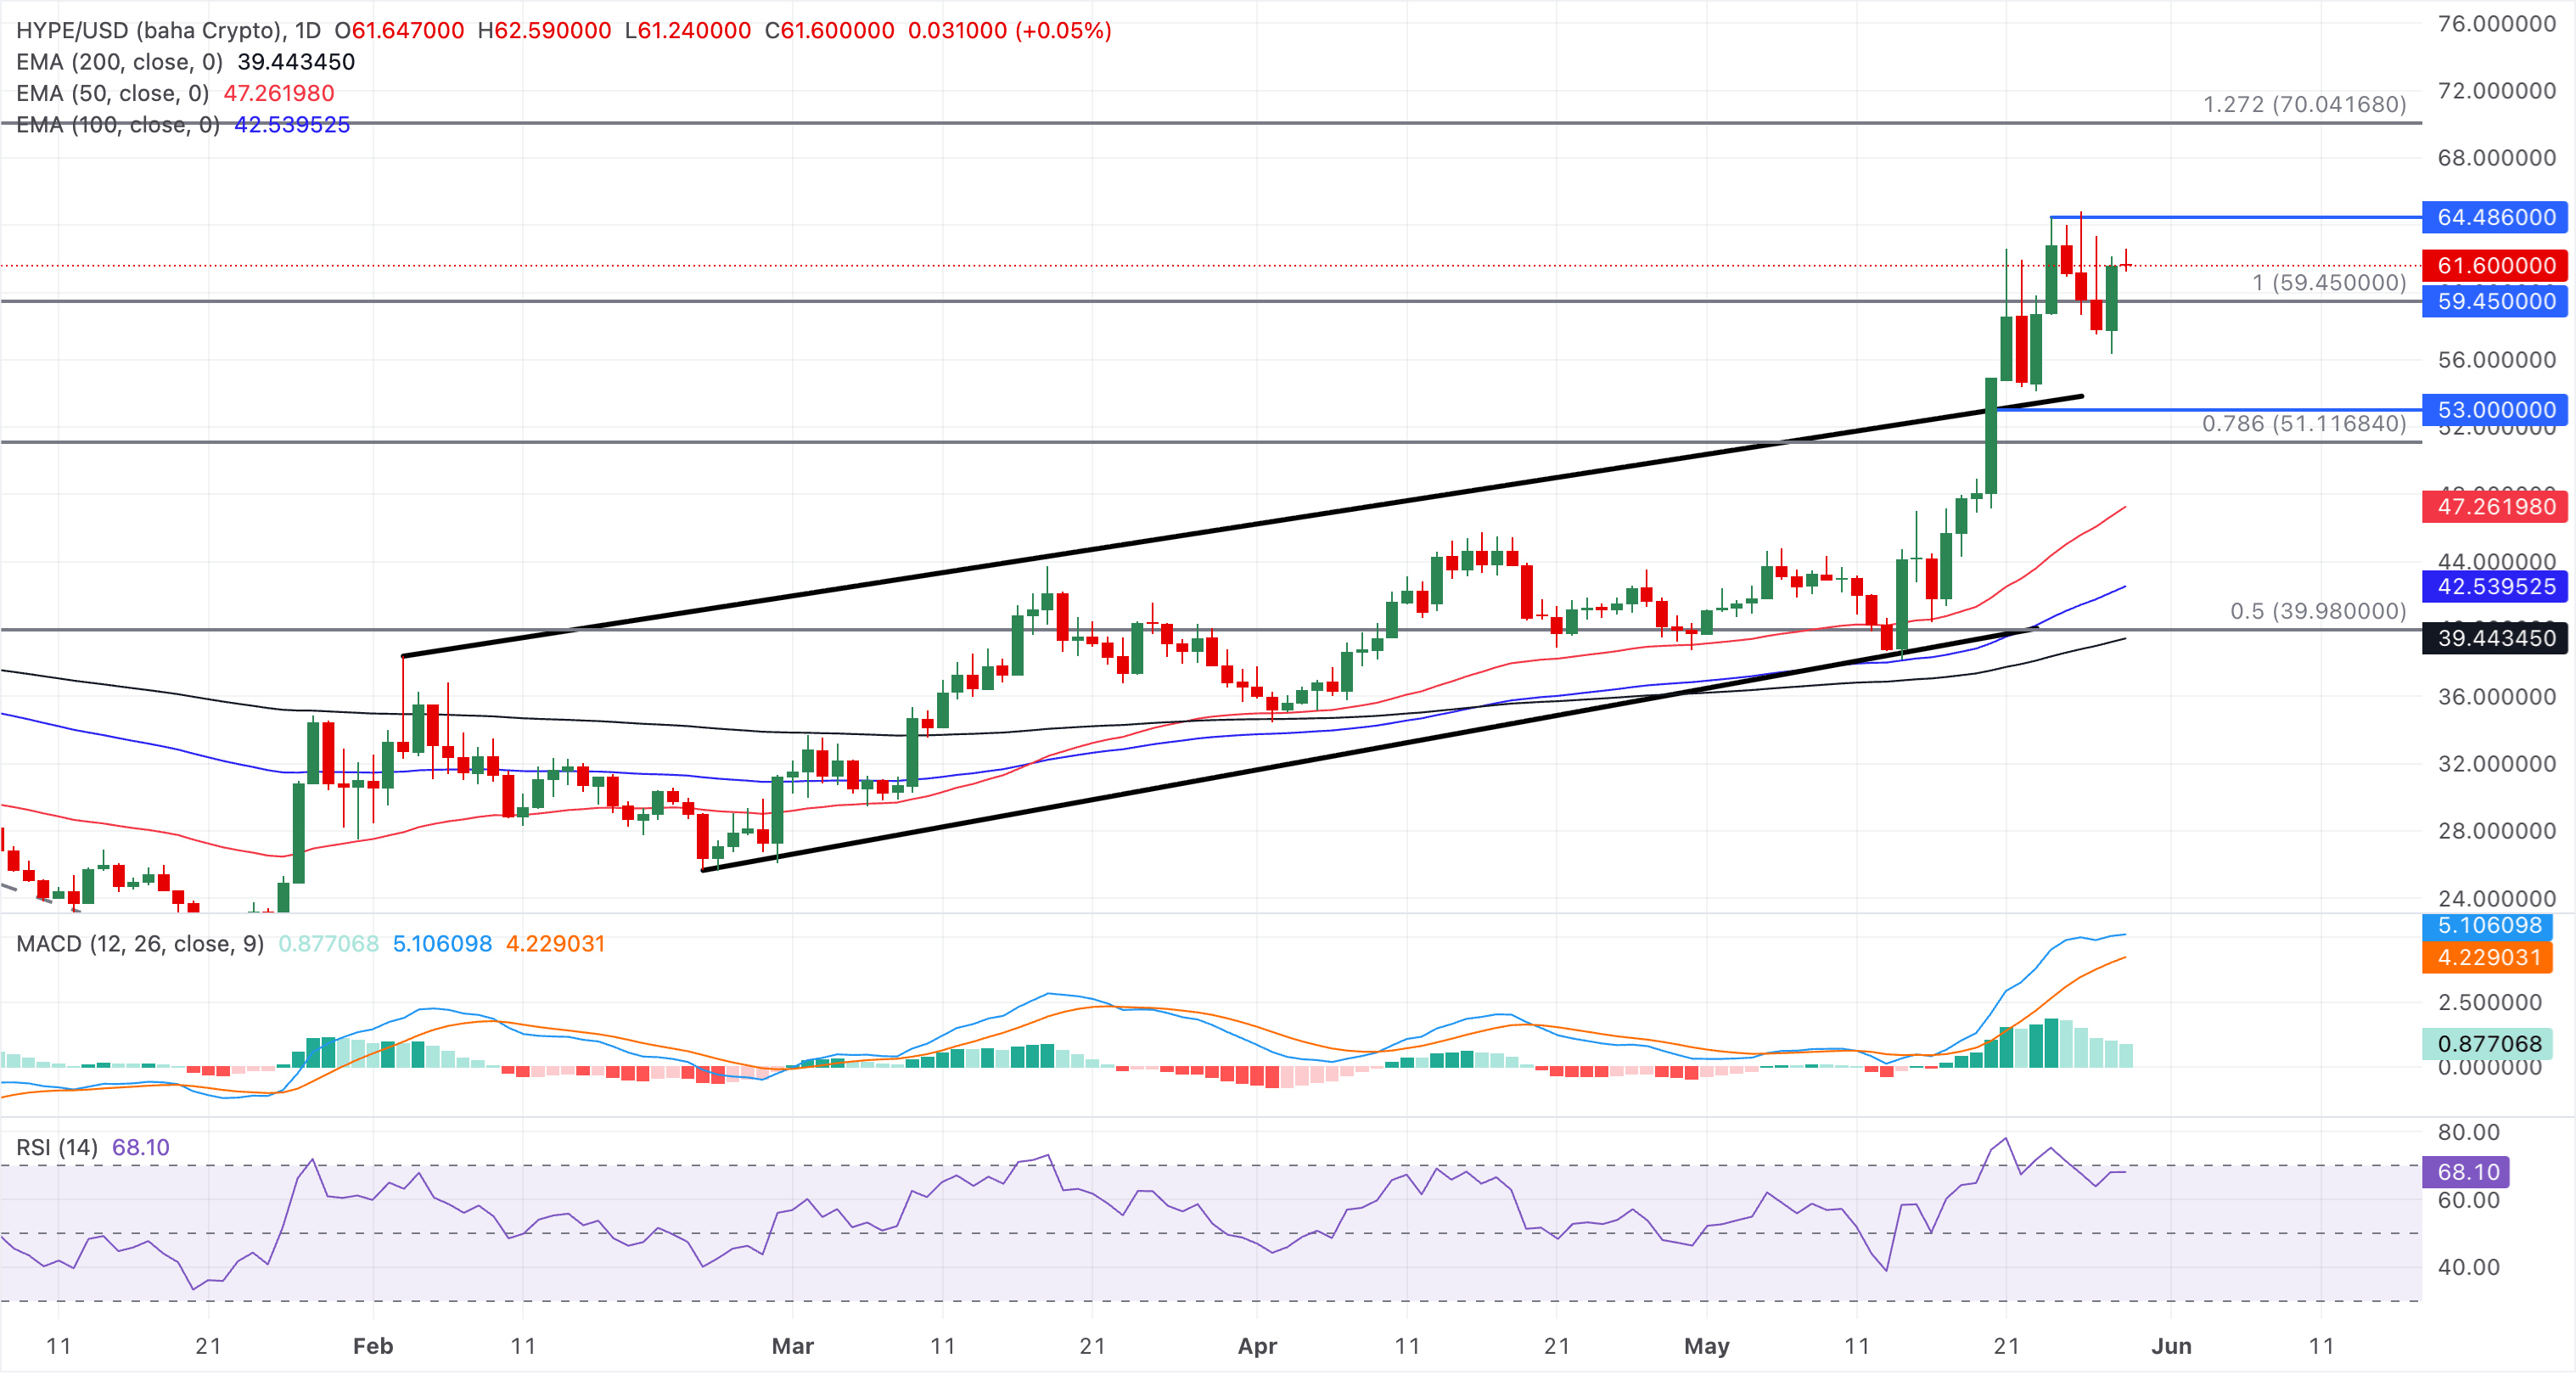
On the downside, initial support is seen at the recent swing high and 100% Fibonacci retracement at $59.45, followed by the 78.6% retracement at $51.12. Below that, the 50-day EMA at $47.26 and the 61.8% retracement at $44.57 form a broader demand band, ahead of deeper support around the 100-day EMA at $42.54 and the prior trend-line break area near $41.02.
(The technical analysis of this story was written with the help of an AI tool.)
Bitcoin, altcoins, stablecoins FAQs
Bitcoin is the largest cryptocurrency by market capitalization, a virtual currency designed to serve as money. This form of payment cannot be controlled by any one person, group, or entity, which eliminates the need for third-party participation during financial transactions.
Altcoins are any cryptocurrency apart from Bitcoin, but some also regard Ethereum as a non-altcoin because it is from these two cryptocurrencies that forking happens. If this is true, then Litecoin is the first altcoin, forked from the Bitcoin protocol and, therefore, an “improved” version of it.
Stablecoins are cryptocurrencies designed to have a stable price, with their value backed by a reserve of the asset it represents. To achieve this, the value of any one stablecoin is pegged to a commodity or financial instrument, such as the US Dollar (USD), with its supply regulated by an algorithm or demand. The main goal of stablecoins is to provide an on/off-ramp for investors willing to trade and invest in cryptocurrencies. Stablecoins also allow investors to store value since cryptocurrencies, in general, are subject to volatility.
Bitcoin dominance is the ratio of Bitcoin's market capitalization to the total market capitalization of all cryptocurrencies combined. It provides a clear picture of Bitcoin’s interest among investors. A high BTC dominance typically happens before and during a bull run, in which investors resort to investing in relatively stable and high market capitalization cryptocurrency like Bitcoin. A drop in BTC dominance usually means that investors are moving their capital and/or profits to altcoins in a quest for higher returns, which usually triggers an explosion of altcoin rallies.
추천 기사


