

XRP and XLM outlook: Improving market sentiment fuels recovery hopes
- XRP extends its recovery on Thursday, following its recent correction, amid steady inflows into spot ETFs.
- XLM retests and rebounds from the key support level at $0.143.
- Improving derivatives and on-chain metrics hint at a potential recovery for both altcoins.
Ripple (XRP) and Stellar (XLM) are showing early signs of recovery on Thursday after recent price corrections. XRP continues its rebound as steady inflows from spot Exchange Traded Funds (ETFs) support improving investor sentiment. Meanwhile, XLM retested and found support from its key technical level. In addition, improving derivatives and on-chain metrics, alongside hopes of US-Iran peace, suggest that bearish pressure may be easing and hint at a potential recovery for both altcoins.
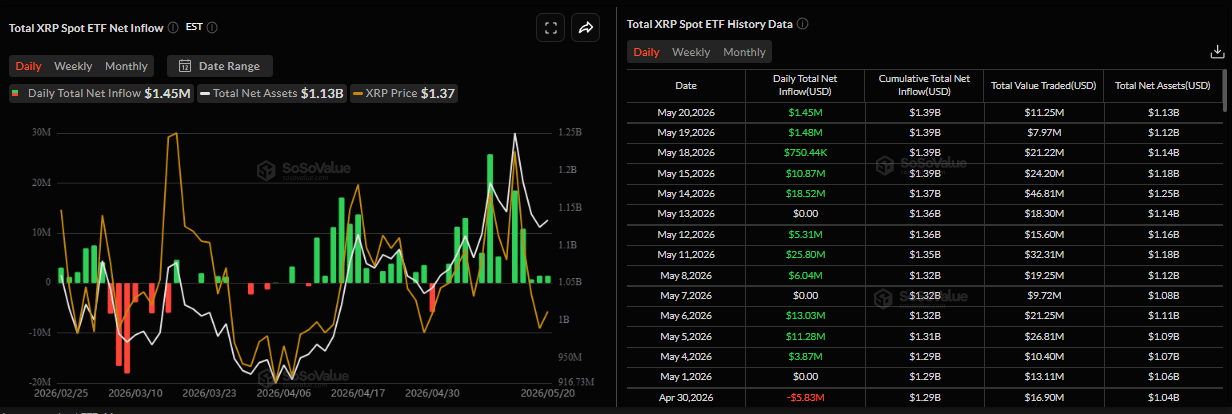
XRP’s spot ETF inflow shows signs of optimism
Despite the recent price correction in XRP, institutional demand remains robust. SoSoValue data shows that XRP’s spot ETFs recorded an inflow of $1.45 million on Wednesday, marking the fifth consecutive day of positive flows since last week. If this inflow trend continues, XRP could see a recovery ahead.
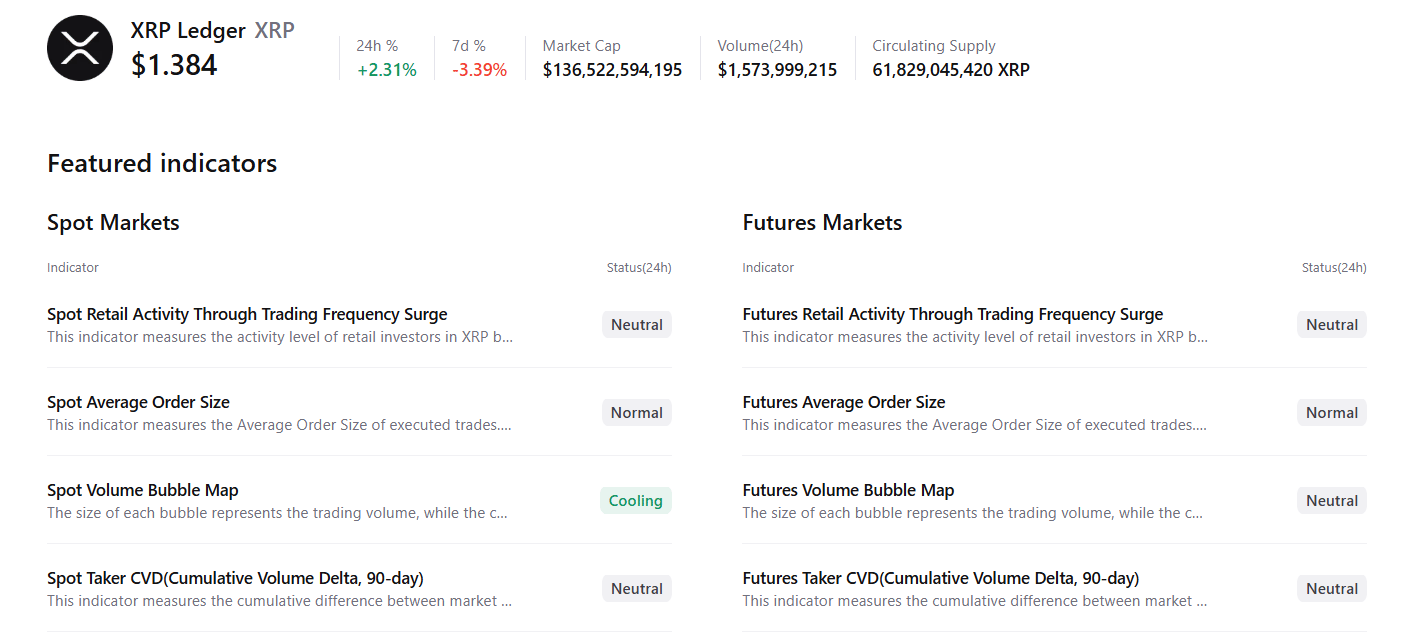
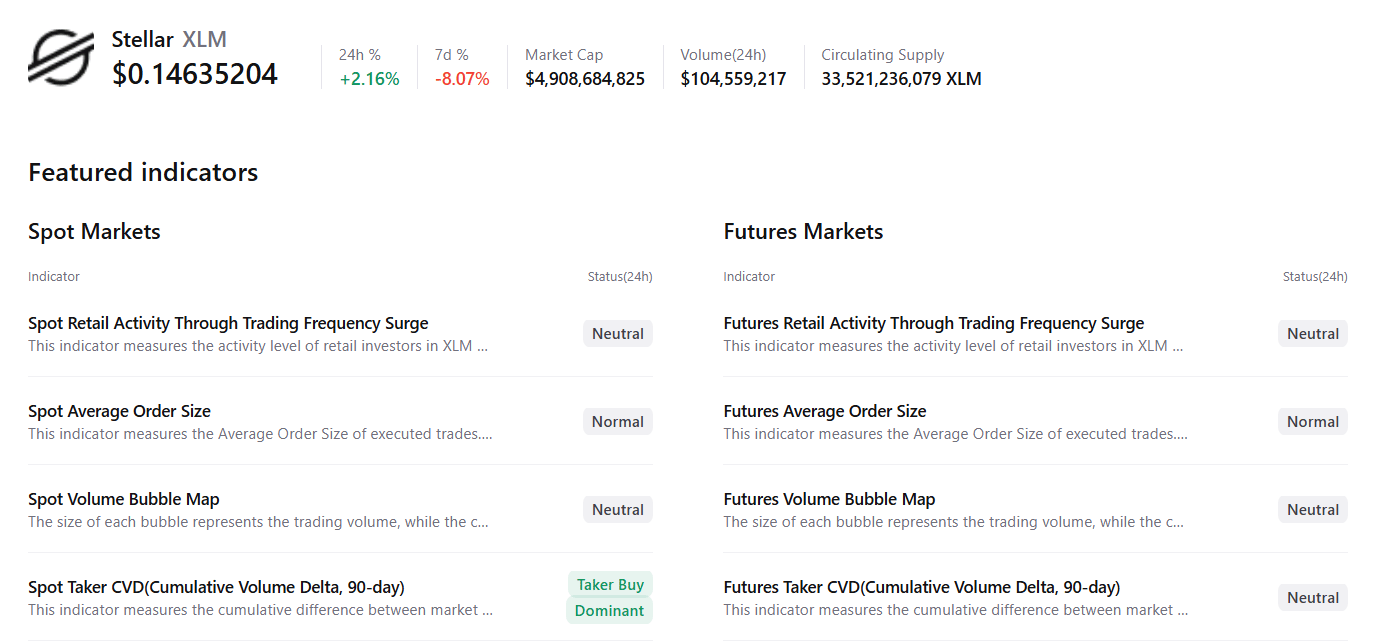
On-chain and derivatives show a mild bullish bias
CryptoQuant’s summary data shows a neutral to mildly bullish sentiment among XRP and XLM traders. XRP’s spot markets show cooling conditions, while XLM’s show buy-side dominance, with both altcoins’ other metrics remaining largely neutral and hinting at mild signs of recovery ahead.
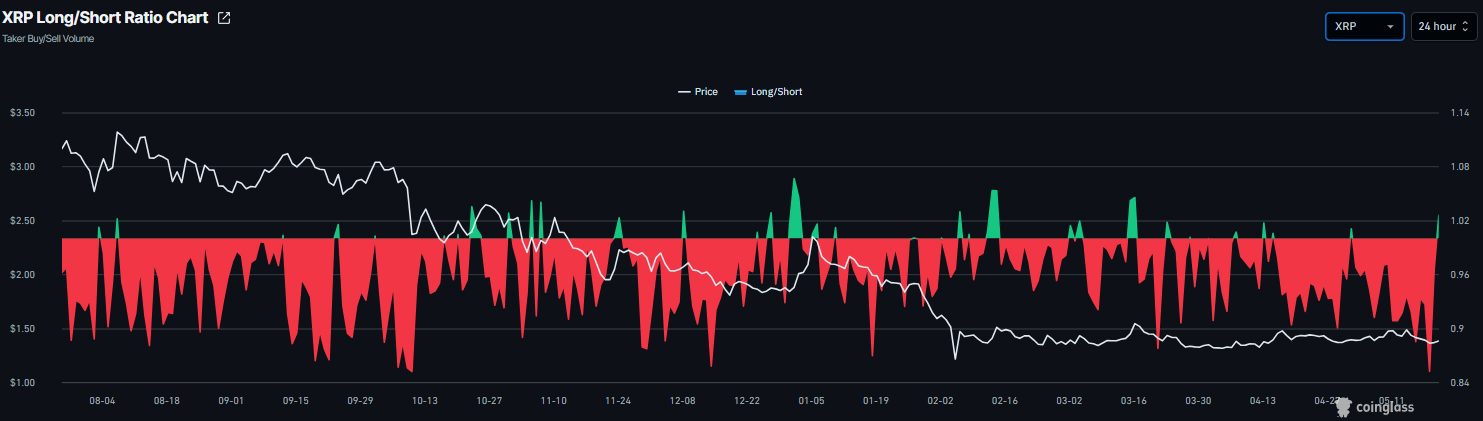
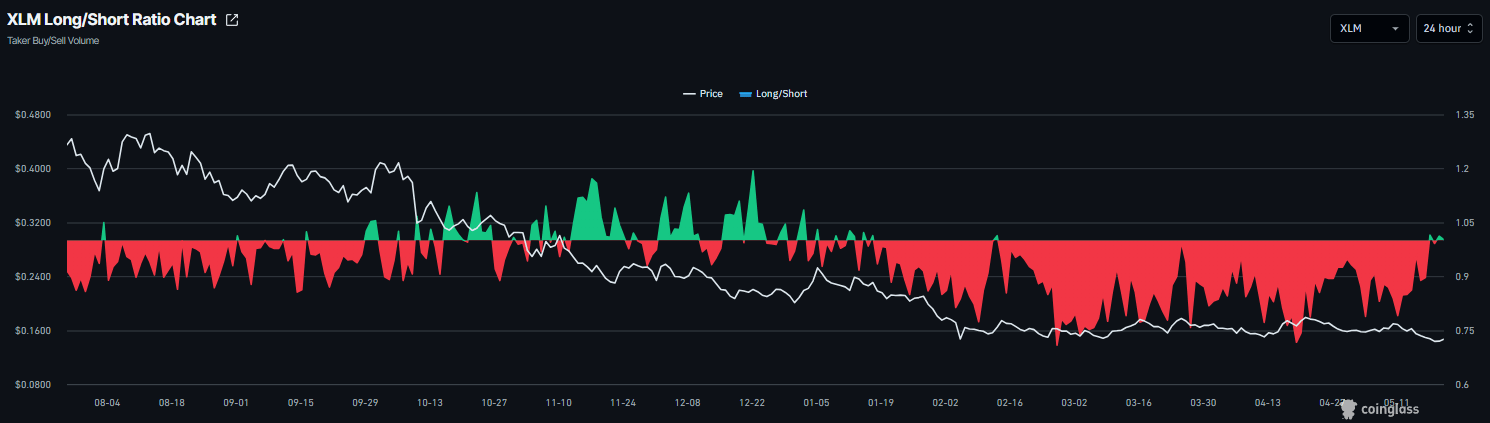
On the derivative side, metrics also support a positive outlook. Coinglass’s long-to-short ratio for both XRP and XLM reads 1.02 and 1.01, respectively, on Thursday. The ratio being above one, indicates bullish sentiment, as traders are betting the asset’s price will rise.
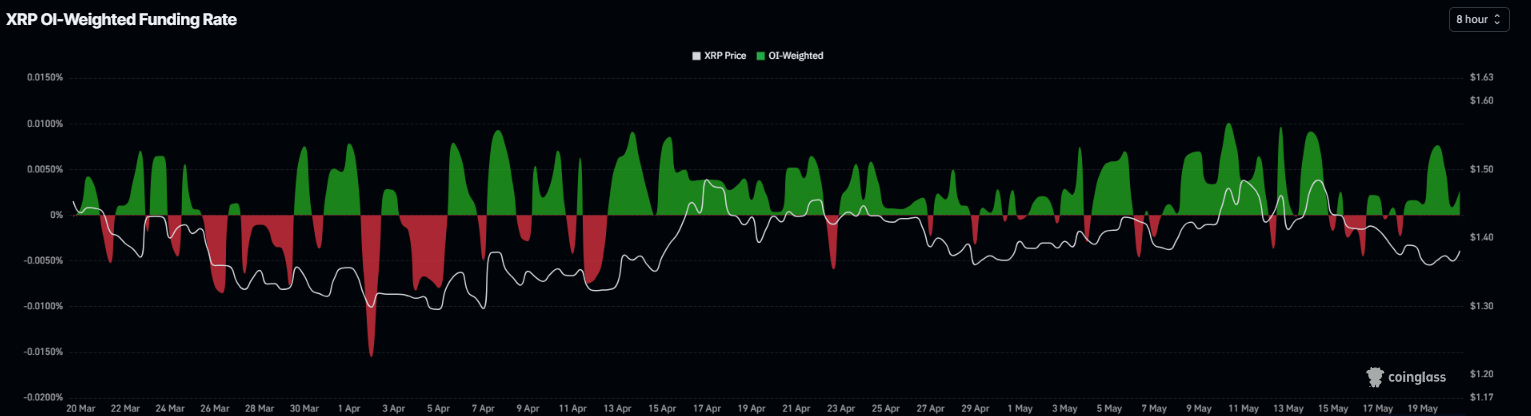
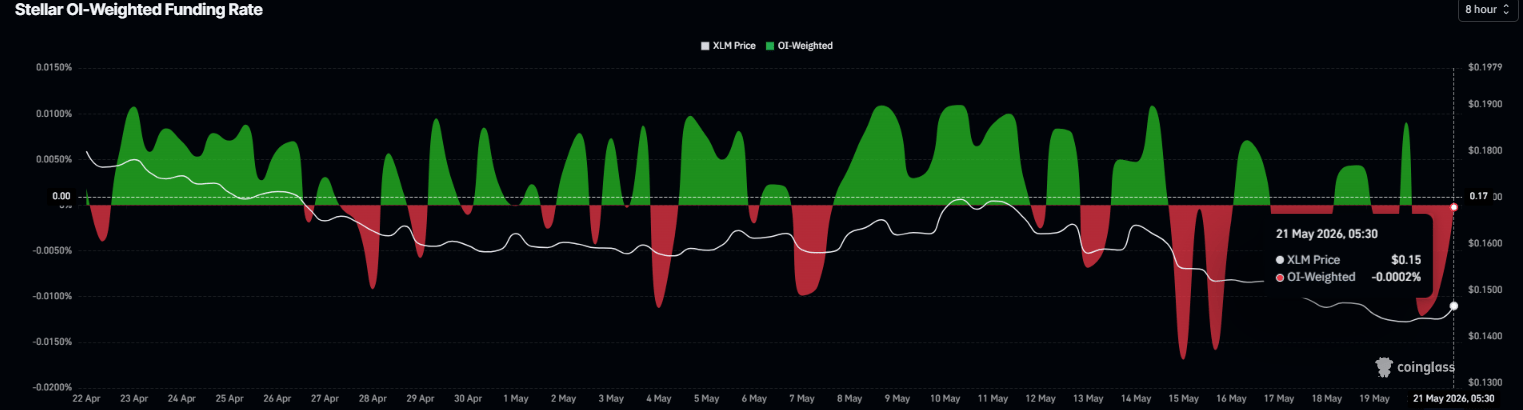
The funding rates also show a positive outlook, with XRP rates flipping positive on Monday and rising to 0.0027% on Thursday. Meanwhile, XLM rates are about to flip positive, reading -0.0002% on the same period. These positive rates indicate that longs are paying shorts and projecting a bullish sentiment.
US-Iran peace hopes lift risk appetite
Risk sentiment among traders is improving after news on Wednesday that US President Donald Trump characterized the ongoing negotiations with Iran as in their final stages. However, President Trump also reiterated a firm pledge to resume military actions within days if Iran rejects his terms.
In response, Iranian President Masoud Pezeshkian emphasized that Tehran has no intention of capitulating, stating on the social media platform X that attempting to force a surrender through coercion is nothing more than an illusion.
These developments have raised hopes for a potential peace agreement between the US and Iran, improving broader market sentiment and supporting risk-sensitive assets, with Bitcoin (BTC) rebounding above $78,000 on Thursday and Ripple and Stellar also extending their recoveries.
XRP technical outlook: Still holds below key level
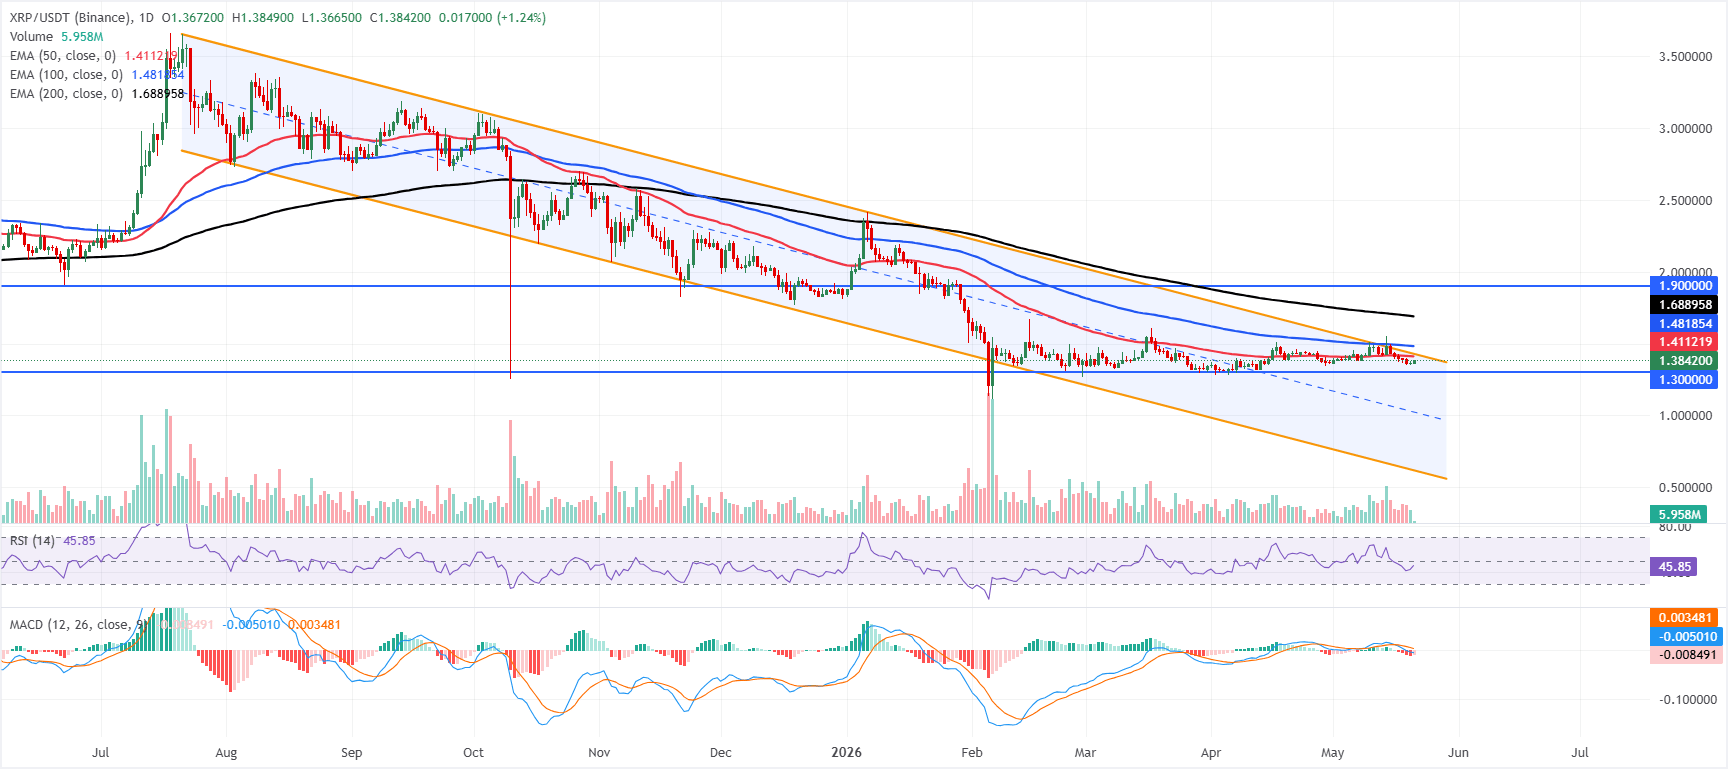
XRP trades at $1.384 on Thursday, extending a corrective tone below a stacked group of Exponential Moving Averages that continue to cap the upside. XRP holds under the 50-day EMA at $1.411, leaving price lodged well beneath the 100-day EMA at $1.481 and the 200-day EMA at $1.688, which collectively suggest that rallies remain vulnerable within a broader bearish context.
Momentum is soft, with the Relative Strength Index (RSI) hovering around 46 and the Moving Average Convergence Divergence (MACD) line holding below zero, suggesting fading buying pressure rather than an imminent trend reversal.
On the topside, initial resistance is at the 50-day EMA around $1.411, with a subsequent barrier at the parallel channel boundary near $1.427, which guards the recent range. Above there, the 100-day EMA at $1.481 and the 200-day EMA at $1.689 form a deeper supply band ahead of the more distant horizontal resistance at $1.900.
On the downside, the first notable support comes in at the horizontal level of $1.300; a daily close below this floor would likely open the way to further losses, while holding above it could keep price confined to consolidation beneath the overhead averages.
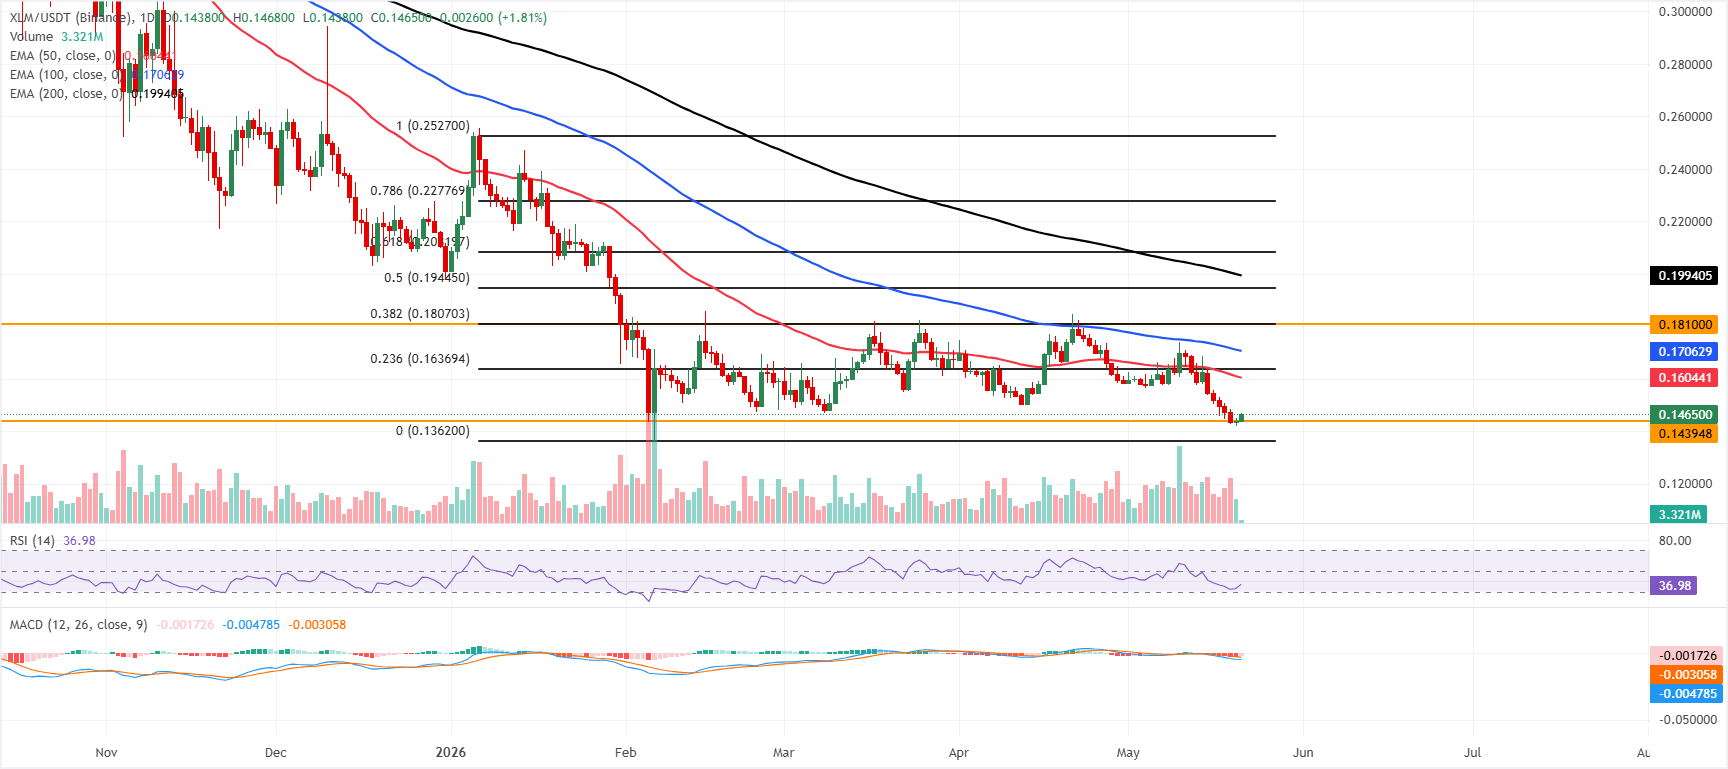
XLM technical outlook: Rebound from key support
Stellar price trades at $0.1465, extending a bearish near-term bias as price holds well below the 50-day, 100-day, and 200-day EMAs. The stack of downward-sloping EMAs above the spot suggests rallies remain corrective within a broader decline, while the RSI on the daily chart near 37 points to weak but not yet oversold momentum. The MACD indicator remains below the zero line, with a negative reading, reinforcing lingering downside pressure after the recent breakdown.
On the downside, immediate support emerges at the recent horizontal floor around $0.1439, with the Fibonacci anchor from the latest swing low near $0.1362 acting as a deeper bearish objective if selling accelerates.
On the topside, initial resistance aligns with the 50-day EMA at $0.1604, followed by the 23.6% Fibonacci retracement at $0.1637 and the 100-day EMA near $0.1706. Above that, a heavier supply zone is located around the 38.2% Fibonacci retracement at $0.1807 and the nearby horizontal resistance at $0.1810, while further recovery attempts would face additional barriers at the 50% retracement at $0.1944 and the 200-day EMA around $0.1994.
(The technical analysis of this story was written with the help of an AI tool.)
Ripple FAQs
Ripple is a payments company that specializes in cross-border remittance. The company does this by leveraging blockchain technology. RippleNet is a network used for payments transfer created by Ripple Labs Inc. and is open to financial institutions worldwide. The company also leverages the XRP token.
XRP is the native token of the decentralized blockchain XRPLedger. The token is used by Ripple Labs to facilitate transactions on the XRPLedger, helping financial institutions transfer value in a borderless manner. XRP therefore facilitates trustless and instant payments on the XRPLedger chain, helping financial firms save on the cost of transacting worldwide.
XRPLedger is based on a distributed ledger technology and the blockchain using XRP to power transactions. The ledger is different from other blockchains as it has a built-in inflammatory protocol that helps fight spam and distributed denial-of-service (DDOS) attacks. The XRPL is maintained by a peer-to-peer network known as the global XRP Ledger community.
XRP uses the interledger standard. This is a blockchain protocol that aids payments across different networks. For instance, XRP’s blockchain can connect the ledgers of two or more banks. This effectively removes intermediaries and the need for centralization in the system. XRP acts as the native token of the XRPLedger blockchain engineered by Jed McCaleb, Arthur Britto and David Schwartz.
추천 기사


