


Pi Network Price Forecast: PI extends downside risk after losing 50-day EMA support
- Pi Network trades at $0.171 on Monday after being rejected and closing below the 50-day EMA at $0.178 the previous day.
- The broader crypto market remains cautious amid renewed tensions between the US and Iran ahead of a second round of peace talks.
- The technical outlook suggests a potential deeper correction, as momentum indicators signal early bearishness.
Pi Network (PI) trades at $0.171 on Monday after being rejected at its 50-day Exponential Moving Average (EMA) near $0.178 and closing below it on Sunday, signaling weakening bullish momentum. The broader crypto market remains cautious amid renewed tensions between the US and Iran in the Strait of Hormuz, keeping pressure on risk assets. Meanwhile, the technical outlook suggests PI could face a deeper correction, as momentum indicators begin to flash early bearish signals.
Tensions over the Strait of Hormuz dampen risk sentiment
The broader market started the week on a cautious note as reports suggest that Iran says it has attacked US military ships with drones in retaliation for the US striking and seizing an Iranian cargo vessel in the Strait of Hormuz.
On Sunday, Iran denied it would participate in new peace talks with the US, hours after US President Donald Trump said US negotiators would head to Pakistan on Monday for a second round of peace talks with Iran.
These renewed tensions in the Middle East have dampened risk sentiment, with Pi Network and other cryptocurrencies seeing a slight pullback on Sunday; PI maintained a capped tone heading into Monday.
Pi Network Price Forecast: PI slips below key support zone
Pi Network's price is trading at $0.171 on Monday after correcting by over 4.5% over the weekend. PI failed to close above the 100-day EMA at $0.187 on Saturday and declined, closing below the 50-day EMA at $0.178 the next day.
If PI continues its correction, it could extend the losses toward the daily support level at $0.153.
The Relative Strength Index (RSI) on the daily chart is 46, slipping below the neutral 50 level, indicating fading bullish momentum. Moreover, the Moving Average Convergence Divergence (MACD) indicator lines are converging, with fading green histogram bars indicating weakening momentum.
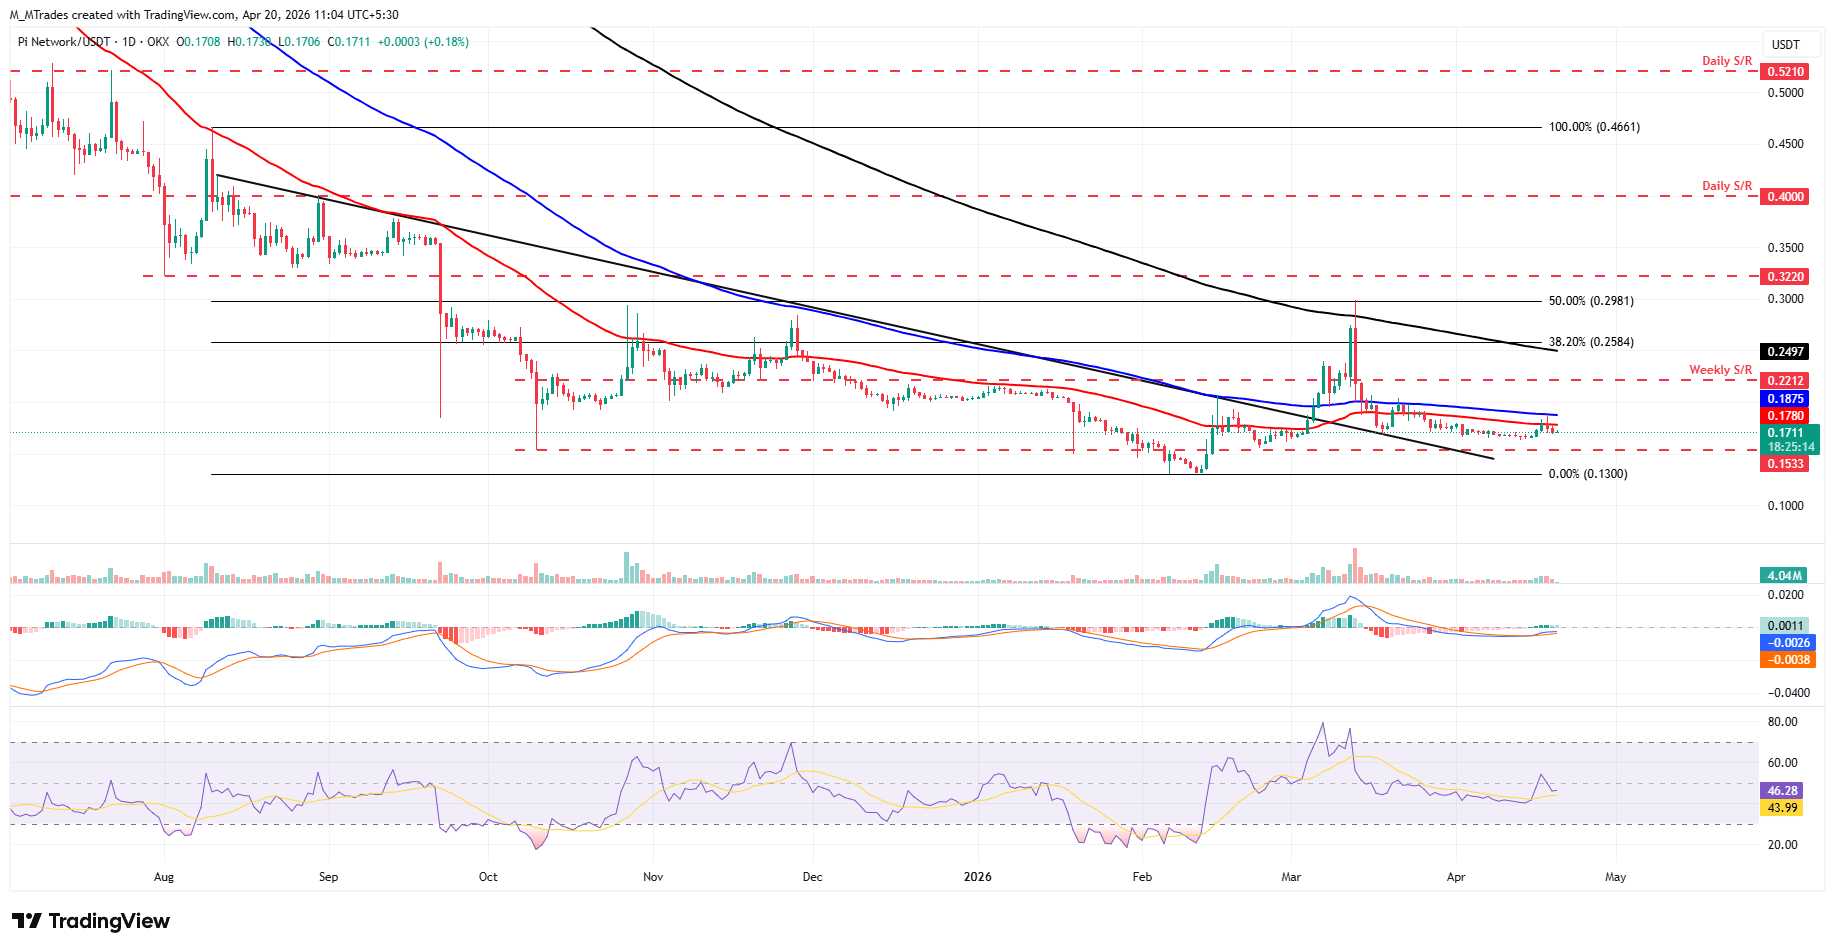
However, if PI recovers, it could extend the advance toward the 50-day EMA at $0.178. A close above this level could extend the gains toward the next key resistance at the 100-day EMA at $0.187.
추천 기사


