


Worldcoin Price Forecast: WLD tests breakout rally as market-wide downside pressure eases
- Worldcoin extends gains above $0.30 on Tuesday, testing the breakout of a descending resistance trendline.
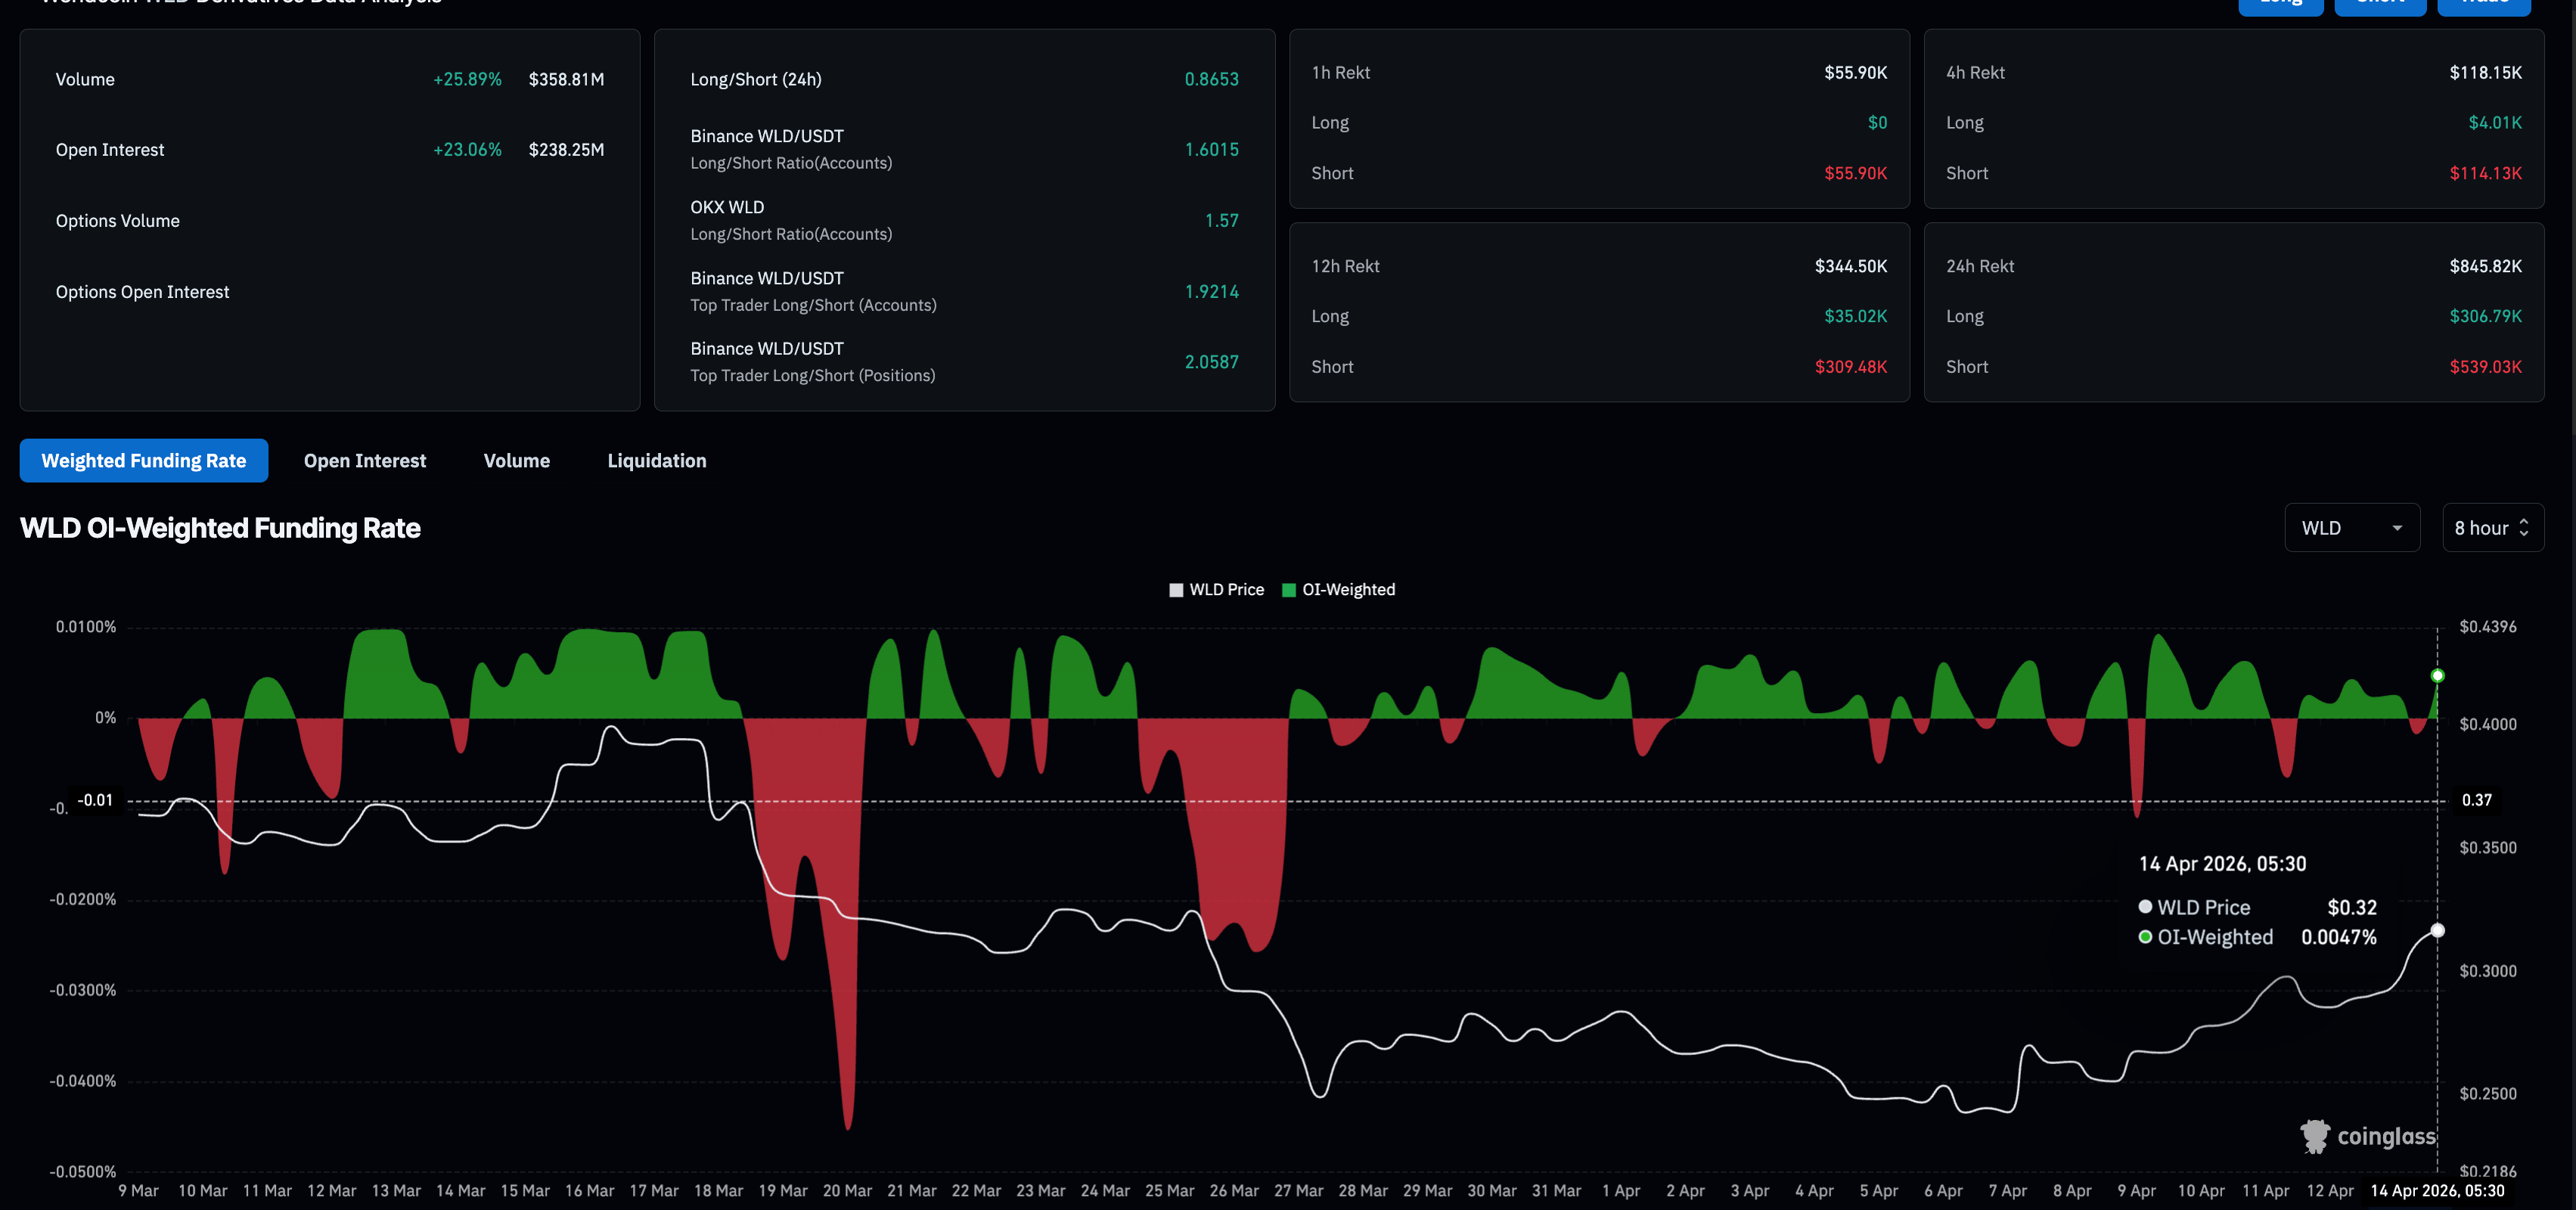
- Derivatives data shows renewed demand for Worldcoin, with Open Interest rising over 20% in 24 hours.
- Worldcoin must reclaim the 50-day EMA to extend the rally toward $0.40.
Worldcoin (WLD) extends gains above $0.3000 at press time on Tuesday after a roughly 8% rise the previous day. The recovery aligns with the broader market's rising risk appetite linked to the US-Iran peace negotiations, prompting traders to turn to WLD derivatives. Technically, the recovery run in Worldcoin tests the breakout of a falling wedge pattern, which could extend gains toward $0.4000.
Worldcoin regains strength as the broader market recovers
Worldcoin shows a steady recovery since the announcement of US-Iran peace talks on April 7, resulting in 15% gains last week. CoinGlass data shows a 23% rise in WLD futures Open Interest (OI) over the last 24 hours, suggesting a positional buildup amid growing anticipation among traders. Meanwhile, the OI-weighted funding rate turns positive to 0.0047%, from -0.0017% the previous day, suggesting near-term buy-side inclination.
Worldcoin is poised for a breakout rally
Worldcoin holds a near-term bullish bias with a recovery within a falling wedge pattern on the daily chart. The 50-day Exponential Moving Average (EMA) at $0.3259 is the first overhead cap, with the 23.6% Fibonacci retracement of the downswing from $0.6539 to $0.2389 at $0.3368, reinforcing a nearby resistance band.
As long as price trades beneath this moving average and Fibonacci barrier, rallies are likely to be treated as corrective within a broader bearish context, with sellers expected to fade strength into the clustered resistance levels above. A break above this zone could target the 100-day EMA at $0.4141 and the 50% retracement level at $0.4460.
The Relative Strength Index around 56 and a positive, rising Moving Average Convergence Divergence (MACD) histogram hint that short-term upside attempts could persist within this still-dominant downtrend structure.
On the downside, initial support is seen near the prior trendline break area around $0.3151; a daily close back below this level would expose the recent swing low zone anchored by the 0.0% Fibonacci level at $0.2389.
(The technical analysis of this story was written with the help of an AI tool.)
추천 기사


