
Bitcoin Price Forecast: BTC reaches highest weekly close, hitting a new all-time high of $125,708
- Bitcoin price hovers near $124,000 on Monday, having gained over 10% last week.
- Market capitalization surpasses $2.47 trillion, overtaking tech giants such as Amazon and Meta Platforms.
- US-listed spot Bitcoin ETFs record $3.24 billion in weekly inflows, the largest since late November.
Bitcoin (BTC) steadies around $124,000 at the time of writing on Monday, after surging more than 10% in the previous week. Hitting an all-time high of $125,708 on Sunday, the BTC’s market capitalization has now surpassed $2.47 trillion, overtaking major tech giants like Amazon and Meta Platforms. Meanwhile, strong institutional demand further supports the bullish outlook, as spot Exchange Traded Funds (ETFs) recorded $3.24 billion in weekly inflows — the largest since November — highlighting growing investor confidence.
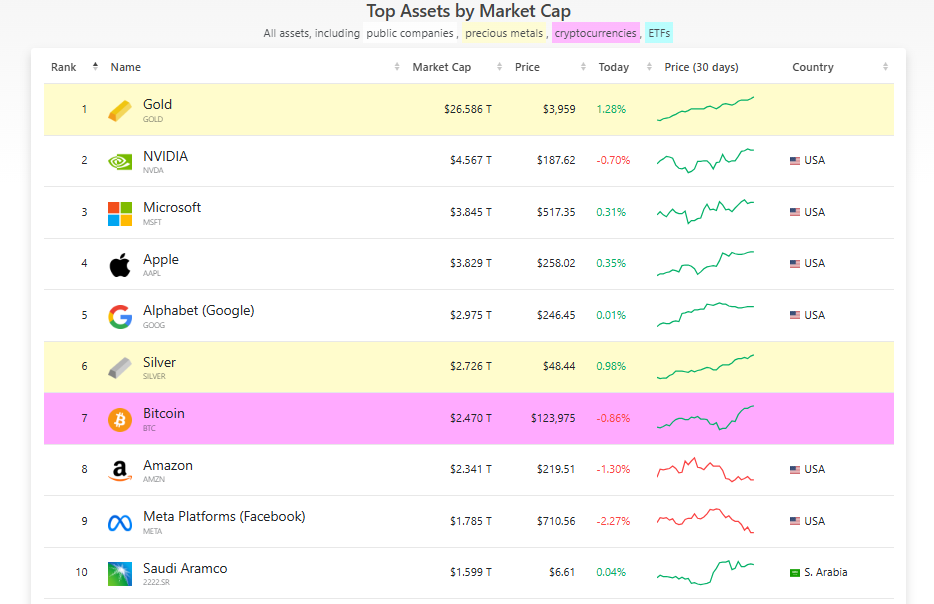
Bitcoin reaches the top 7 assets by market capitalization in the world
Bitcoin soared more than 10% last week and reached a new all-time high of $125,708 on Sunday.
The chart below shows that the surge in BTC propelled its market capitalization beyond $2.47 trillion, allowing it to surpass tech giants like Amazon (AMZN) and Meta Platforms (META) and secure the seventh spot among the world’s top assets by market cap.
Highest weekly inflow in ten months
Bitcoin price surge was also supported by strong institutional demand. According to SoSoValue data (chart below), Bitcoin spot ETFs recorded a total of $3.24 billion in weekly inflow by Friday last week, the highest weekly inflow since the end of November.
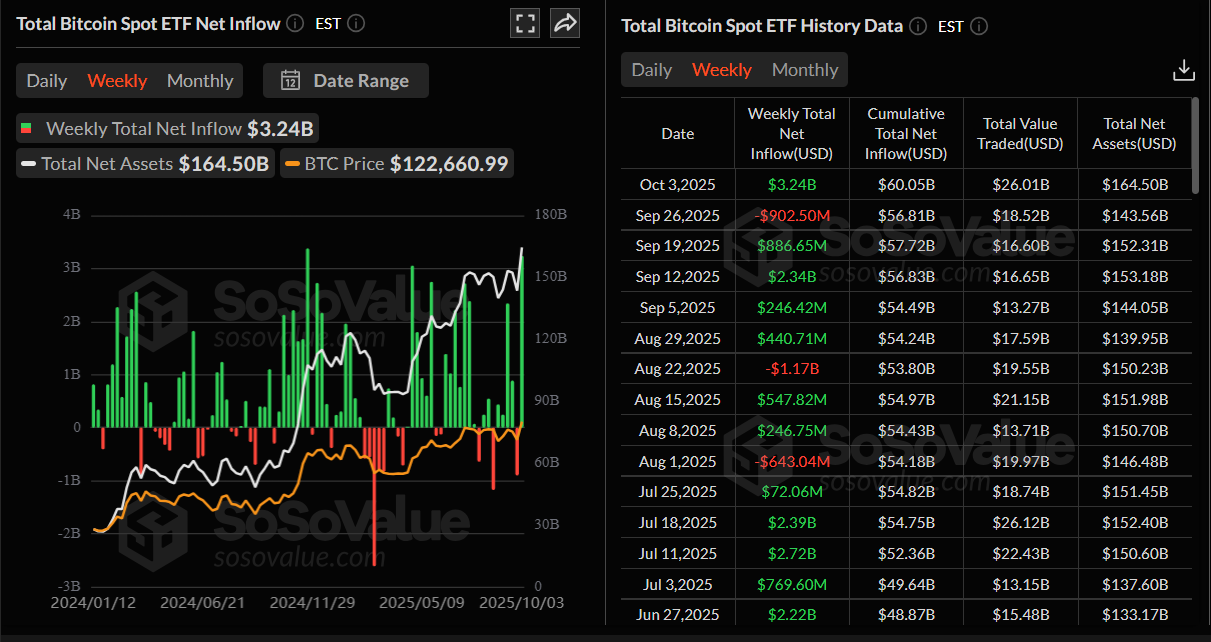
Total Bitcoin Spot ETF net inflow weekly chart. Source: SoSoValue
Start of bullish conditions for Bitcoin in Q4
CryptoQuant reported last week that bullish conditions are expected to start in Q4 at the same level as last year. The graph below shows that the Bitcoin Bull Score Index has been at 40 to 50 in the last few days of Q3 2025, the same levels as at the end of Q3 2024. These levels represent the threshold before conditions turn bullish according to the index. Similarly, in the previous year, as the index crossed above 50, bullish conditions prevailed, and the price of Bitcoin rallied from $70,000 to $100,000 for the first time in its history.
Additionally, the fourth quarter of the year has typically been bullish for Bitcoin’s price performance, as previously reported.
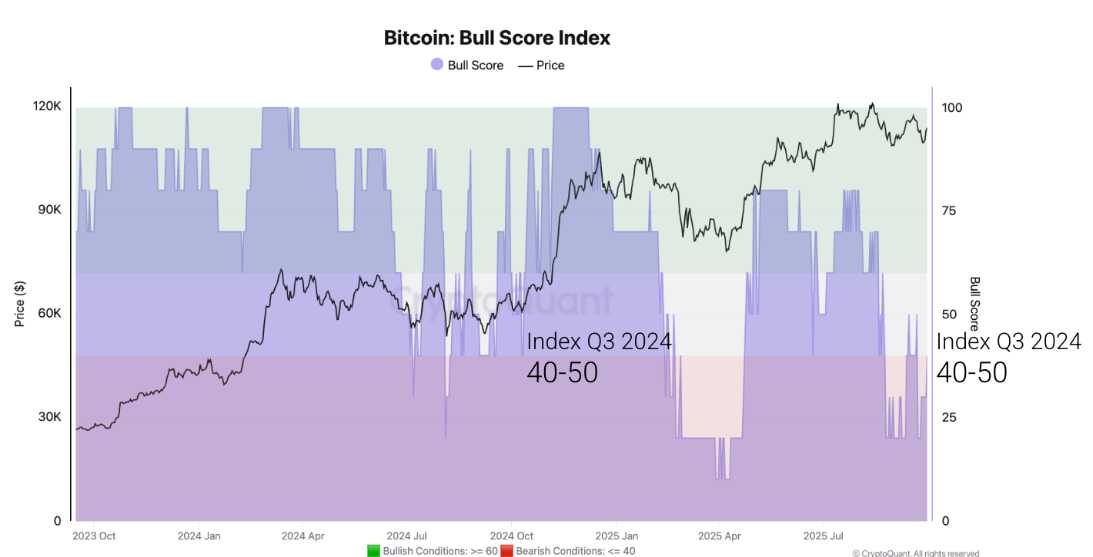
Bitcoin: Bull Score Index Source: CryptoQuant
The report also explained that the Spot Bitcoin demand enters Q4 in expansion mode. Bitcoin’s apparent demand has been growing since July, standing at a 62,000 monthly growth rate. Growing demand is a necessary condition for Bitcoin prices to rally, as this condition can be observed in the historical data for Q4 of 2020, 2021, and 2024 gathered in the chart below (indicated by the red circles).
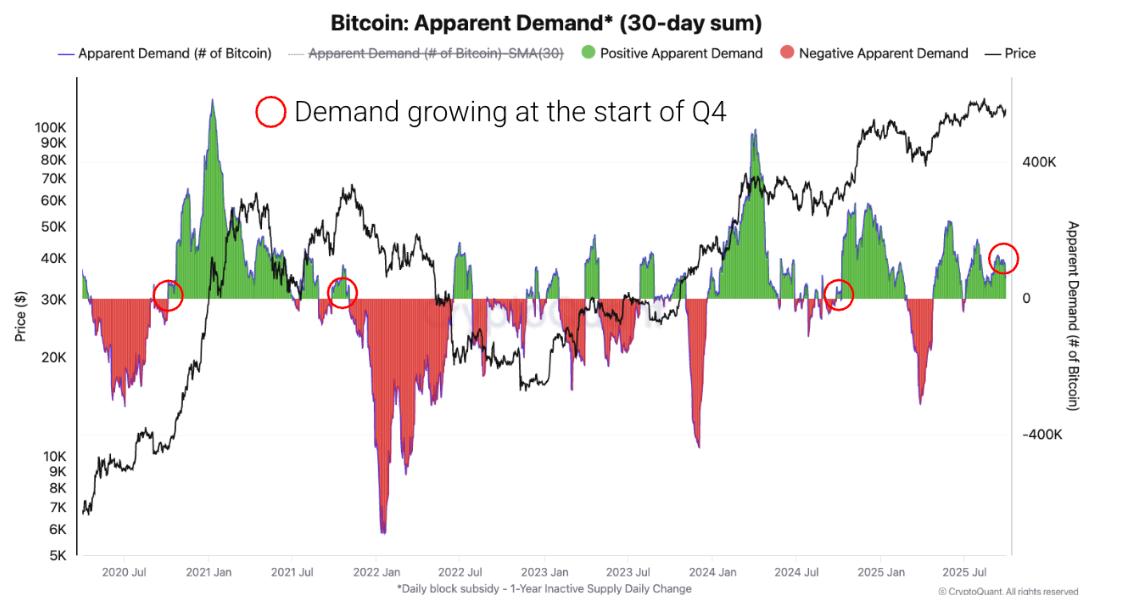
Bitcoin Apparent Demand (30-day sum) chart. Source: CryptoQuant
Bitcoin Price Forecast: BTC bulls aiming for new record high around $130K
Bitcoin price on the weekly chart shows that it has closed at its highest weekly close of $123,482, rallying by more than 10% last week. At the start of this week, on Monday, BTC trades at around $124,000.
If BTC continues its upward trend, it could extend the rally toward the key psychological level at $130,000.
The Relative Strength Index (RSI) on the weekly chart reads 64, which is above the neutral level of 50, indicating that bullish momentum is gaining traction. Moreover, Moving Average Convergence Divergence (MACD) lines are also about to flip to a bullish crossover on the weekly chart, while the falling red histogram bars also indicate the fading of bearish momentum.
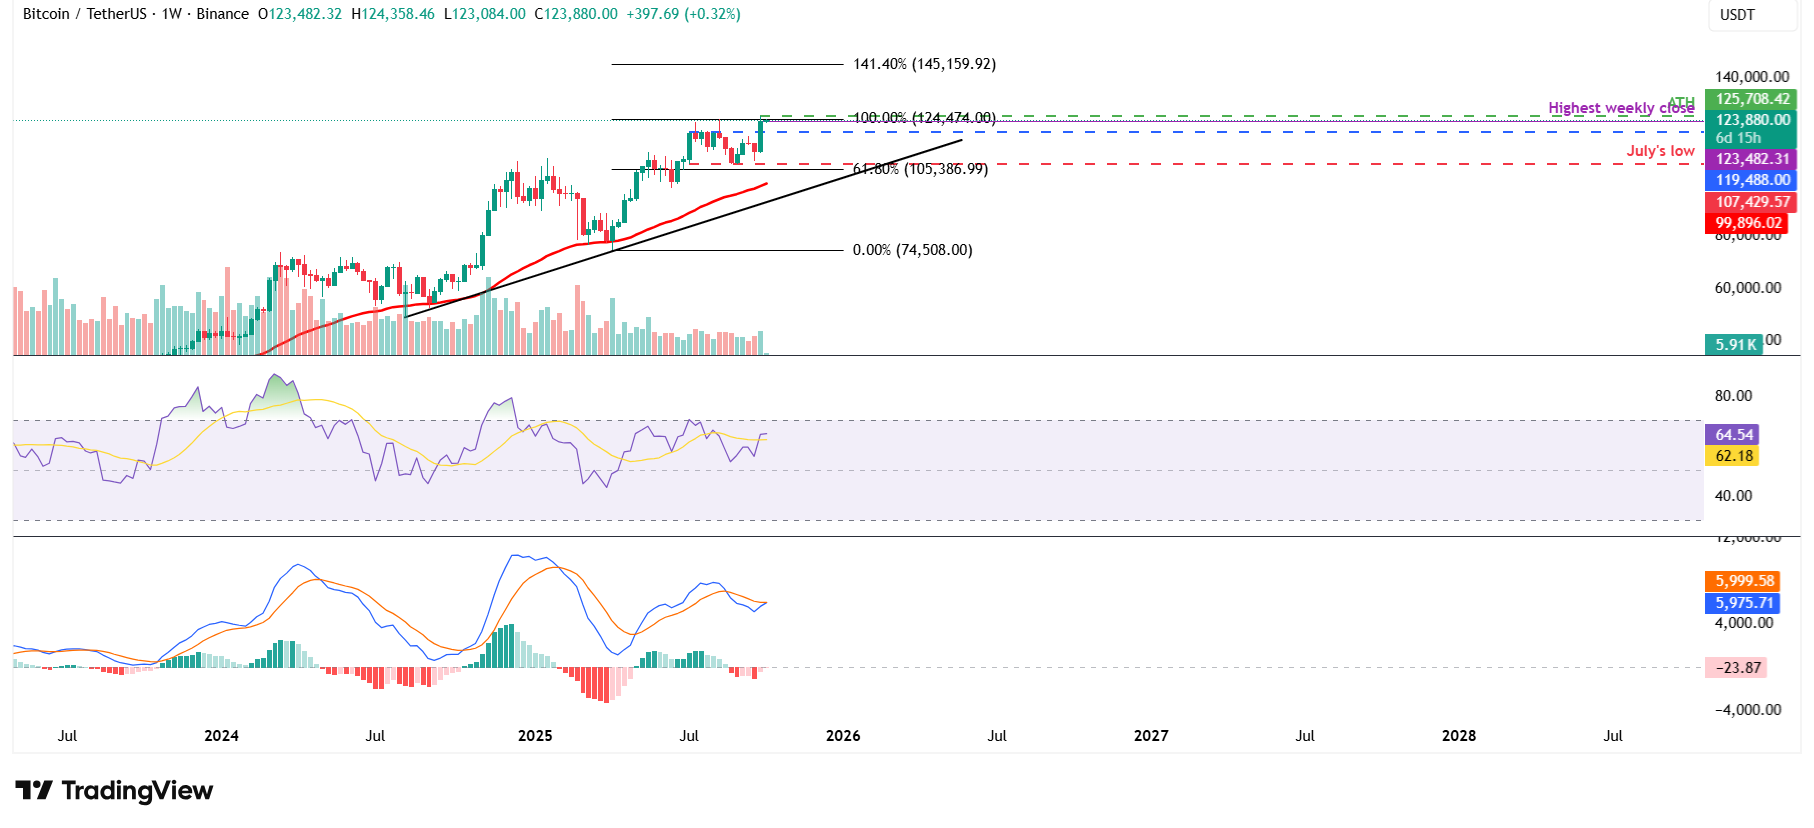
BTC/USDT weekly chart
On the daily chart, after breaking above the $120,000 resistance level on Thursday, BTC soared to a new all-time high on Sunday at $125,708.
The RSI here reads 71, above the overbought conditions and pointing upward, suggesting strong bullish momentum. Moreover, the MACD also showed a bullish crossover last week. Additionally, the rising green histogram bars above the neutral level further indicate a bullish momentum and continuation of an upward trend.
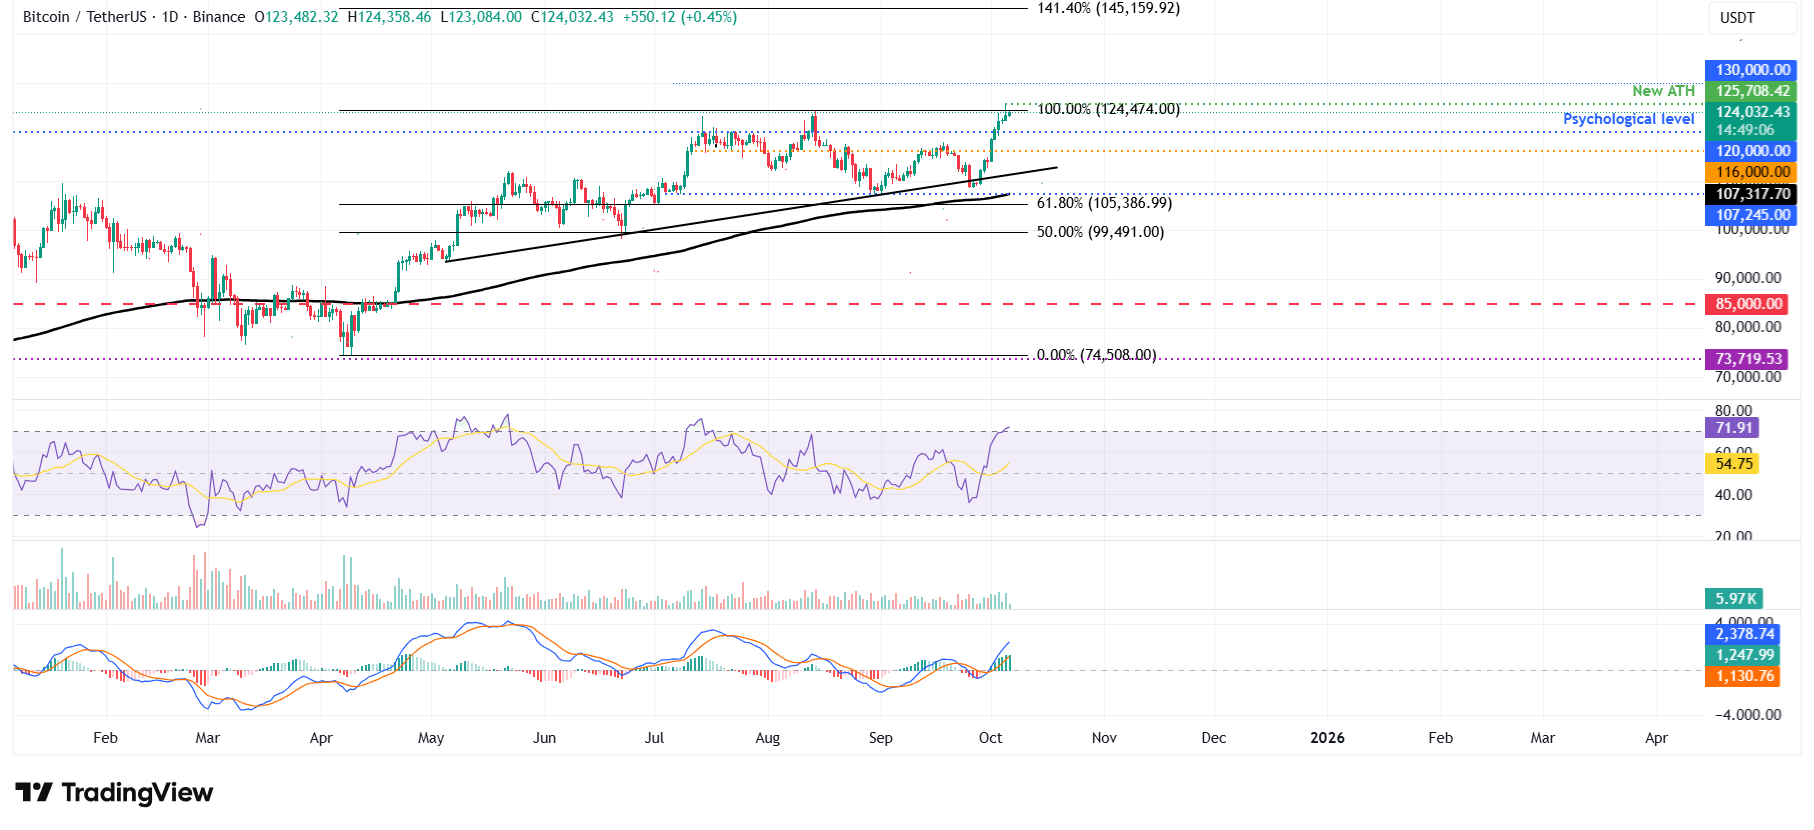
BTC/USDT daily chart
However, if BTC faces a correction, it could extend the decline toward the key support at $120,000.
Bitcoin, altcoins, stablecoins FAQs
Bitcoin is the largest cryptocurrency by market capitalization, a virtual currency designed to serve as money. This form of payment cannot be controlled by any one person, group, or entity, which eliminates the need for third-party participation during financial transactions.
Altcoins are any cryptocurrency apart from Bitcoin, but some also regard Ethereum as a non-altcoin because it is from these two cryptocurrencies that forking happens. If this is true, then Litecoin is the first altcoin, forked from the Bitcoin protocol and, therefore, an “improved” version of it.
Stablecoins are cryptocurrencies designed to have a stable price, with their value backed by a reserve of the asset it represents. To achieve this, the value of any one stablecoin is pegged to a commodity or financial instrument, such as the US Dollar (USD), with its supply regulated by an algorithm or demand. The main goal of stablecoins is to provide an on/off-ramp for investors willing to trade and invest in cryptocurrencies. Stablecoins also allow investors to store value since cryptocurrencies, in general, are subject to volatility.
Bitcoin dominance is the ratio of Bitcoin's market capitalization to the total market capitalization of all cryptocurrencies combined. It provides a clear picture of Bitcoin’s interest among investors. A high BTC dominance typically happens before and during a bull run, in which investors resort to investing in relatively stable and high market capitalization cryptocurrency like Bitcoin. A drop in BTC dominance usually means that investors are moving their capital and/or profits to altcoins in a quest for higher returns, which usually triggers an explosion of altcoin rallies.
추천 기사


