Bitcoin Weekly Forecast: BTC steadies after a massive sell-off
- Bitcoin price extends thedecline this week, correcting over 10% from its record high.
- Crypto markets faces $1.8 billion in liquidations this week, with over 74% of the losses coming from long positions.
- The market outlook stays cautious, as spot demand remains neutral and perpetual futures sentiment leans bearish yet fragile.
Bitcoin (BTC) extends its decline this week, trading below $110,000 at the time of writing on Friday. The largest cryptocurrency has fallen more than 10% from its August record high, with over $1.8 billion in liquidations rattling crypto markets, mostly from long positions. Traders should remain cautious as spot demand stays neutral and perpetual futures sentiment appears fragile.
BTC corrects despite Fed Chair Powell dovish remarks
Bitcoin price opened the week under pressure, extending its decline and crashing by over 13% from the August 14 record high of $124,474 to a low of $108,666 on Tuesday. This price correction comes despite the dovish remarks from Federal Reserve Chair Jerome Powell at Jackson Hole last week, who said that the central bank will adopt a new policy framework of flexible inflation targeting and eliminate the 'makeup' strategy for inflation. "Framework calls for a balanced approach when the central bank's goals are in tension," Powell added.
This price correction in the largest cryptocurrency by market capitalization had triggered a wave of liquidation across the market. CoinGlass Total Liquidation chart below shows that the overall crypto market faced over $1.8 billion in liquidations this week, with more than 74% of the positions being long, indicating overly bullish positioning. Apart from liquidating overleveraged long positions, BTC recorded over $544.3 million in long liquidations, with the largest single liquidation occurring on Huobi exchange (HTX), worth $39.24 million.

Total Liquidation chart Source: Coinglass
On the macroeconomic front, markets leaned slightly risk-positive as Bitcoin stabilized near $110,000, supported by stronger US data mid-week. The US Bureau of Economic Analysis (BEA) revised the annualized Gross Domestic Product (GDP) growth for the second quarter to 3.3% from 3.1%, also the weekly Initial Jobless Claims fell to 229,000 from 234,000, signaling resilience in the labor market. Now, traders await the US core Personal Consumption Expenditures (PCE) Price Index for July due later, the last key inflation release before the Federal Reserve’s September meeting, which could impart a fresh directional move for riskier assets such as BTC.
American Bitcoin expects to trade on the Nasdaq
American Bitcoin, the BTC miner backed by two of US President Donald Trump's sons, has locked in crypto and traditional investors to back an all-stock merger that will allow the firm to start trading on the Nasdaq soon, Reuters reported on Thursday. American Bitcoin’s merger with Gryphon Digital Mining (GRYP.O) is nearly completed, and the goal is to start trading in early September, according to Asher Genoot, the CEO of Hut 8.
"Instead of going public directly via IPO, we thought that there was a lot more advantages to financing if we had an existing company that already had access to different financing too," Genoot told Reuters at the Bitcoin Asia ongoing conference in Hong Kong.
The Bitcoin Asia conference, which kicked off in Hong Kong on Thursday, is the world’s second-largest event of the cyptocurrency, underscoring the growing influence and acceptance of BTC in Asia, particularly in Hong Kong.
Eric Trump is also in Hong Kong and will travel to Tokyo over the weekend for an event hosted by Metaplanet, a Japanese Bitcoin treasury firm, according to Reuters.
Institutional and corporate added BTC during recent price dips
The demand from institutional and corporate companies for Bitcoin strengthened despite its price correction. SoSoValue data show that Bitcoin Spot Exchange Traded Funds (ETFs) recorded a total inflow of $567.35 million so far this week, compared to a $1.17 billion outflow in the previous week. If the inflows continue and intensify, BTC could see a recovery ahead.
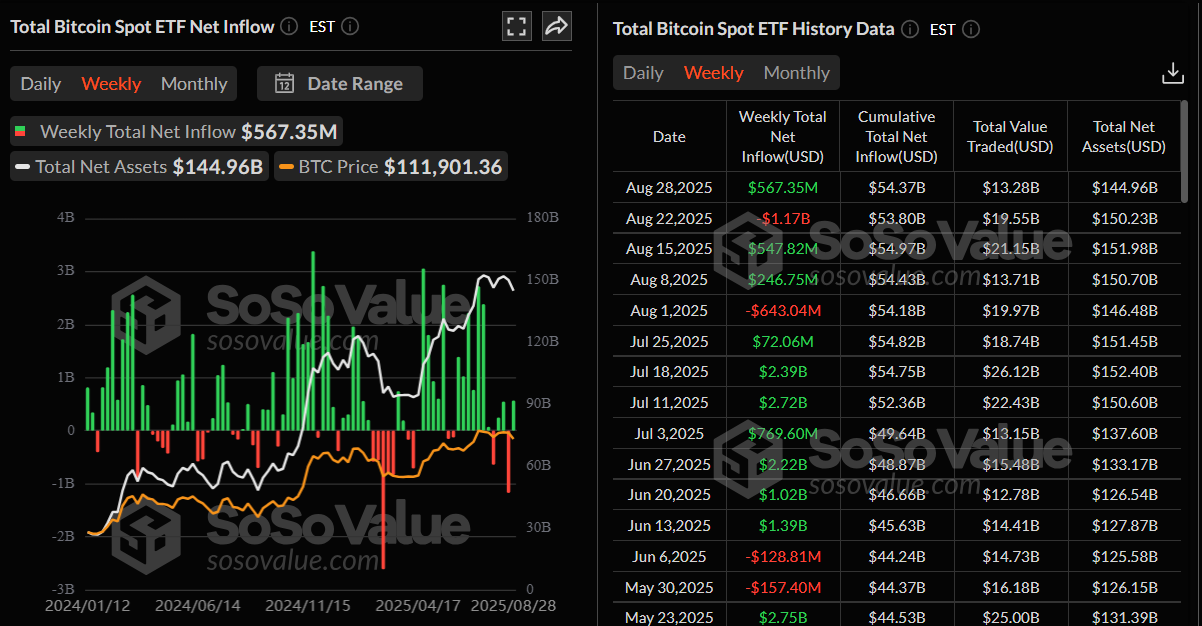
Total Bitcoin Spot ETF Net Weekly Inflow Chart. Source: SoSoValue
On the corporate front, the demand from BTC also showed some signs of interest. Treasury companies such as Metaplanet and Strategy had added a total of 3,184 BTC on Monday, comfortably buying at these price dips.

On-chain data outlook
A Glassnode report this week highlighted that BTC spot demand remained neutral and perpetuals leaned bearish but were fragile.
The chart below shows that the 30-day moving average of Cumulative Volume Delta (CVD) against its 180-day median across major venues, such as Coinbase and Binance, has recently converged toward zero. This represents a notable change from the buying pressure observed in April, which fuelled the rebound from $72,000. While a small positive spike in July helped drive the rally toward $124,000, the broader trend now reflects a neutralization of spot sentiment, suggesting less conviction among buyers at the current level.
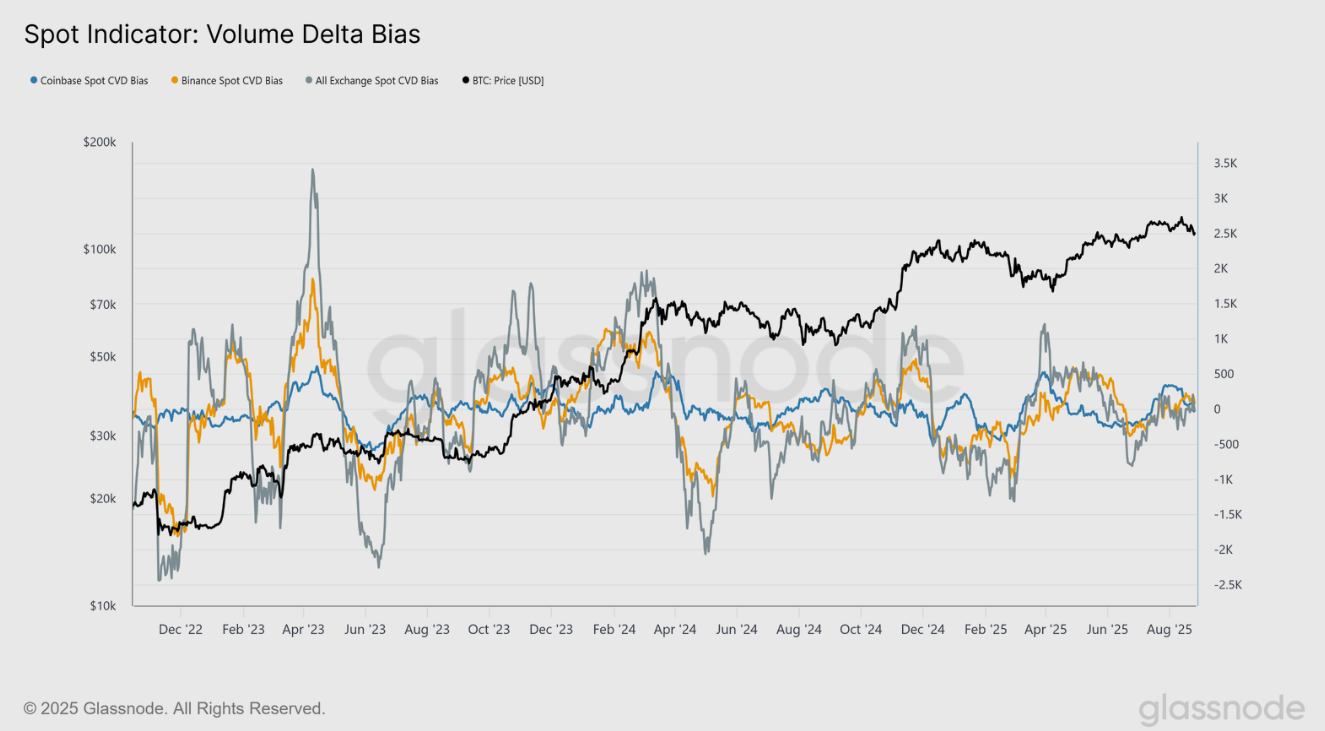
BTC Spot indicator: Volume Delta bias chart Source: Glassnode
Looking at the derivatives side, the report highlighted that the picture has shifted decisively bearish. The futures chart below shows that since July, the CVD has declined into negative territory, signalling a growing imbalance toward sell pressure. This suggests that perpetual traders, often acting as the more speculative segment of the market, have been increasingly leaning short during the recent pullback.
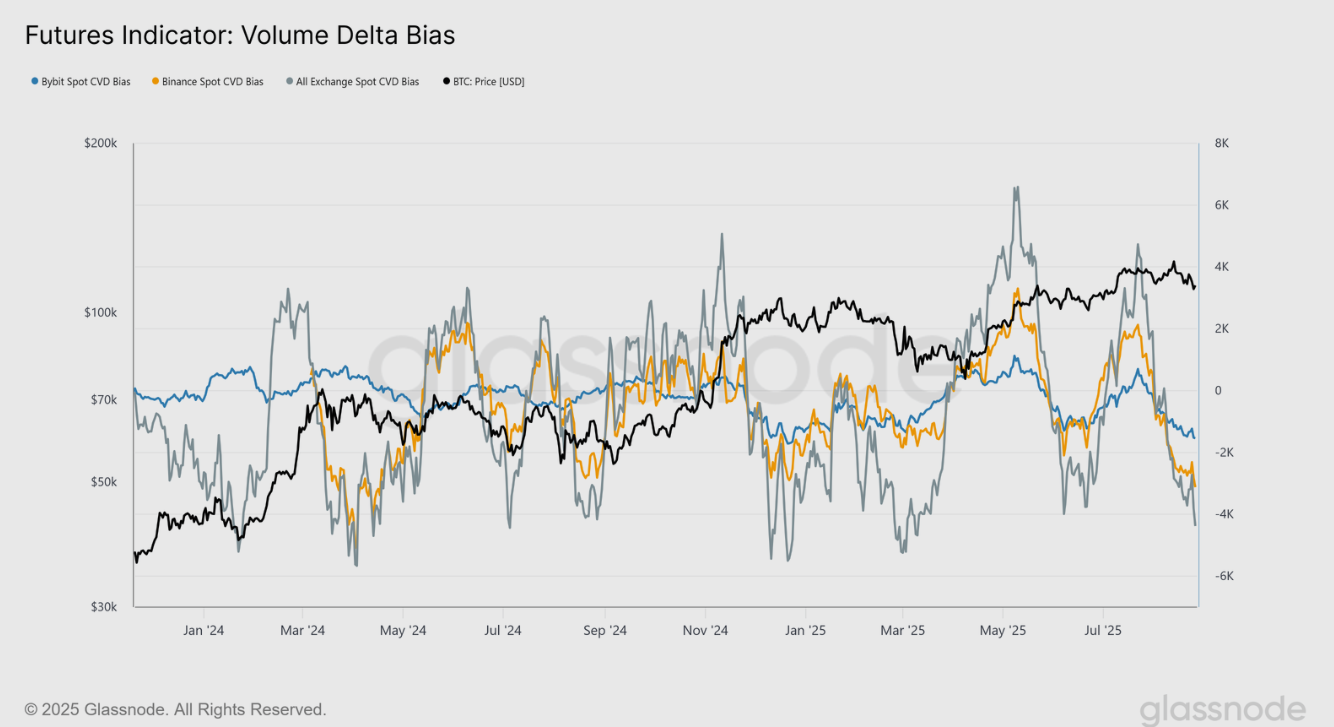
BTC Futures Indicator: Volume Delta bias chart Source: Glassnode
What is there for Bitcoin in September?
Bitcoin reached a new all-time high of $124,474 on August 14 but failed to maintain the gains, declining by over 3% so far for the month. According to Bitcoin’s historical data, BTC generally yielded a negative return for traders in September, with an average gain of 3.77%. If the Fed decides to cut interest rates in September, followed by a rise in ETFs and corporate demand for BTC, traders could see positive returns in that month.
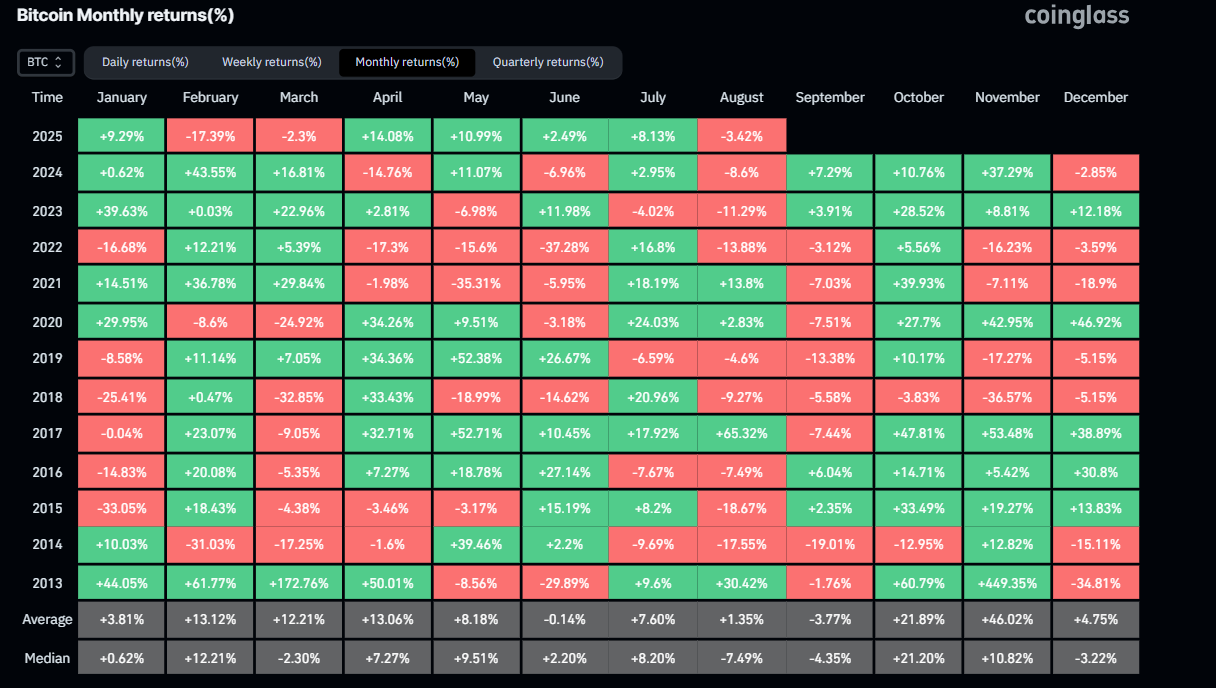
Bitcoin historical monthly returns chart. Source: Coinglass
Is BTC out of the woods?
Bitcoin price on the weekly chart shows three consecutive weeks of decline since mid-August, following its record high of $124,474. As of this week, BTC has declined by over 3% at the time of writing, falling below its support level at $111,980.
If BTC continues its correction, it could extend the decline toward its weekly support at $104,463.
The Relative Strength Index (RSI) on the weekly chart reads 54, pointing downward toward its neutral level of 50, indicating fading bullish momentum. The Moving Average Convergence Divergence (MACD) is also showing a bearish crossover this week, showing signs of an early bearish trend ahead.
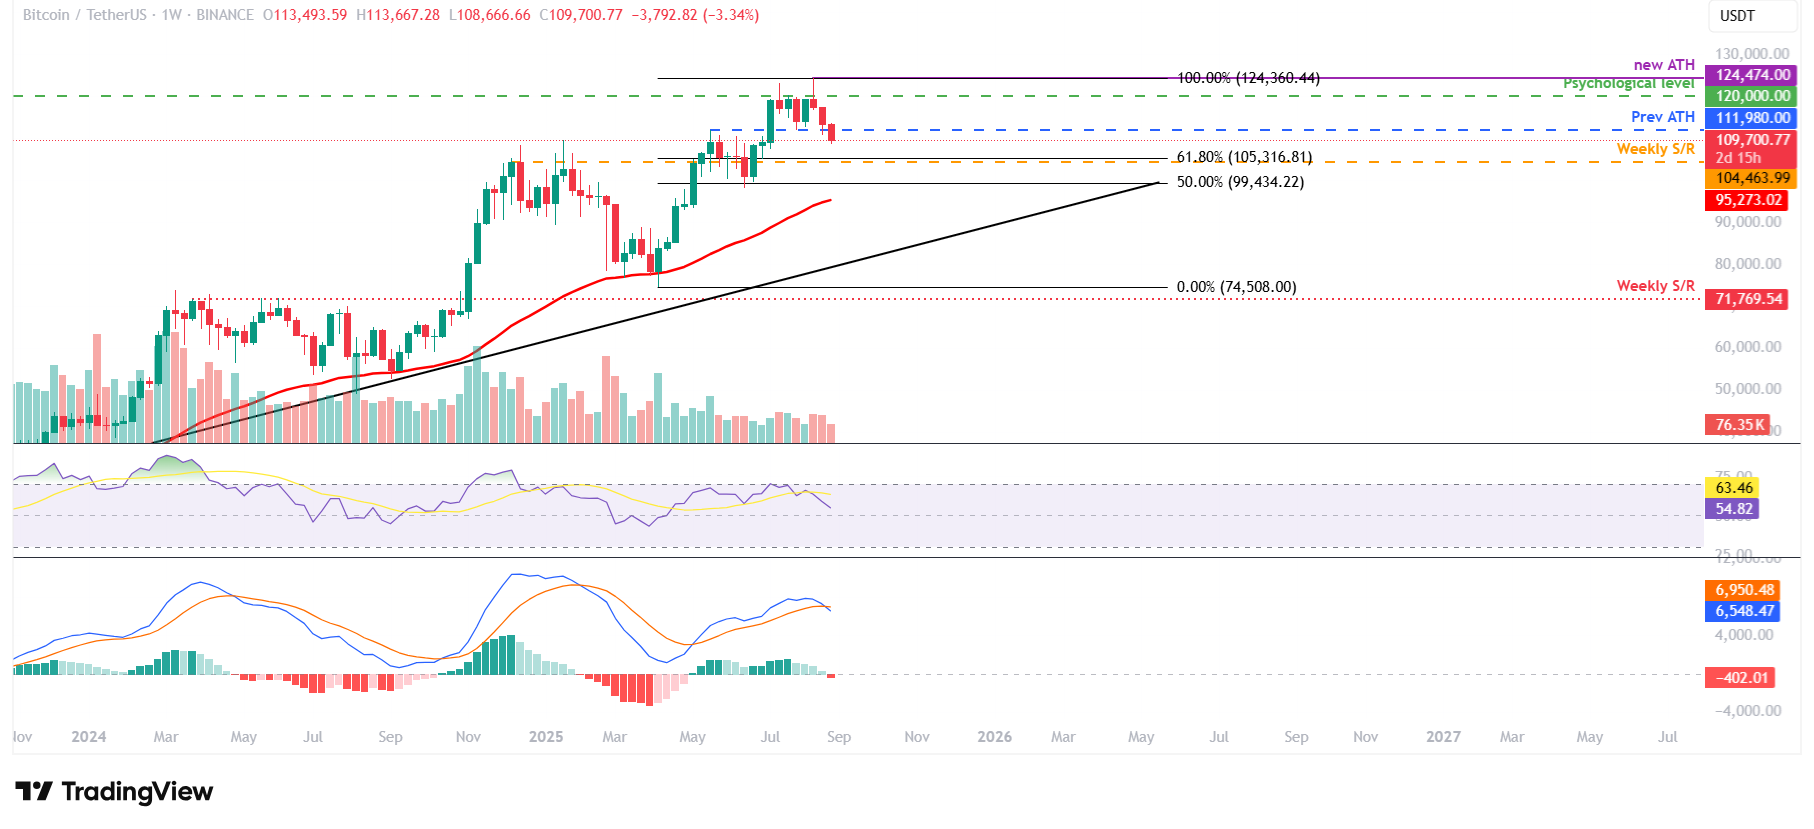
BTC/USDT weekly chart
On the daily chart, BTC also shows signs of weakness. BTC found rejection from a previously broken trendline on Saturday and declined by more than 5% until Monday, closing below its 100-day Exponential Moving Average (EMA) at $110,849. However, BTC recovered slightly on Tuesday and found support around this level for the next two days. At the time of writing on Friday, it trades down, slipping below its 100-day EMA, and trading below $110,000.
If BTC continues its correction and closes below its 100-day EMA at $110,849 on a daily basis, it could extend the decline toward its next key support level, which is the 200-day EMA at $103,974.
The RSI on the daily chart reads 39, which is below its neutral level of 50, indicating strong bearish momentum.
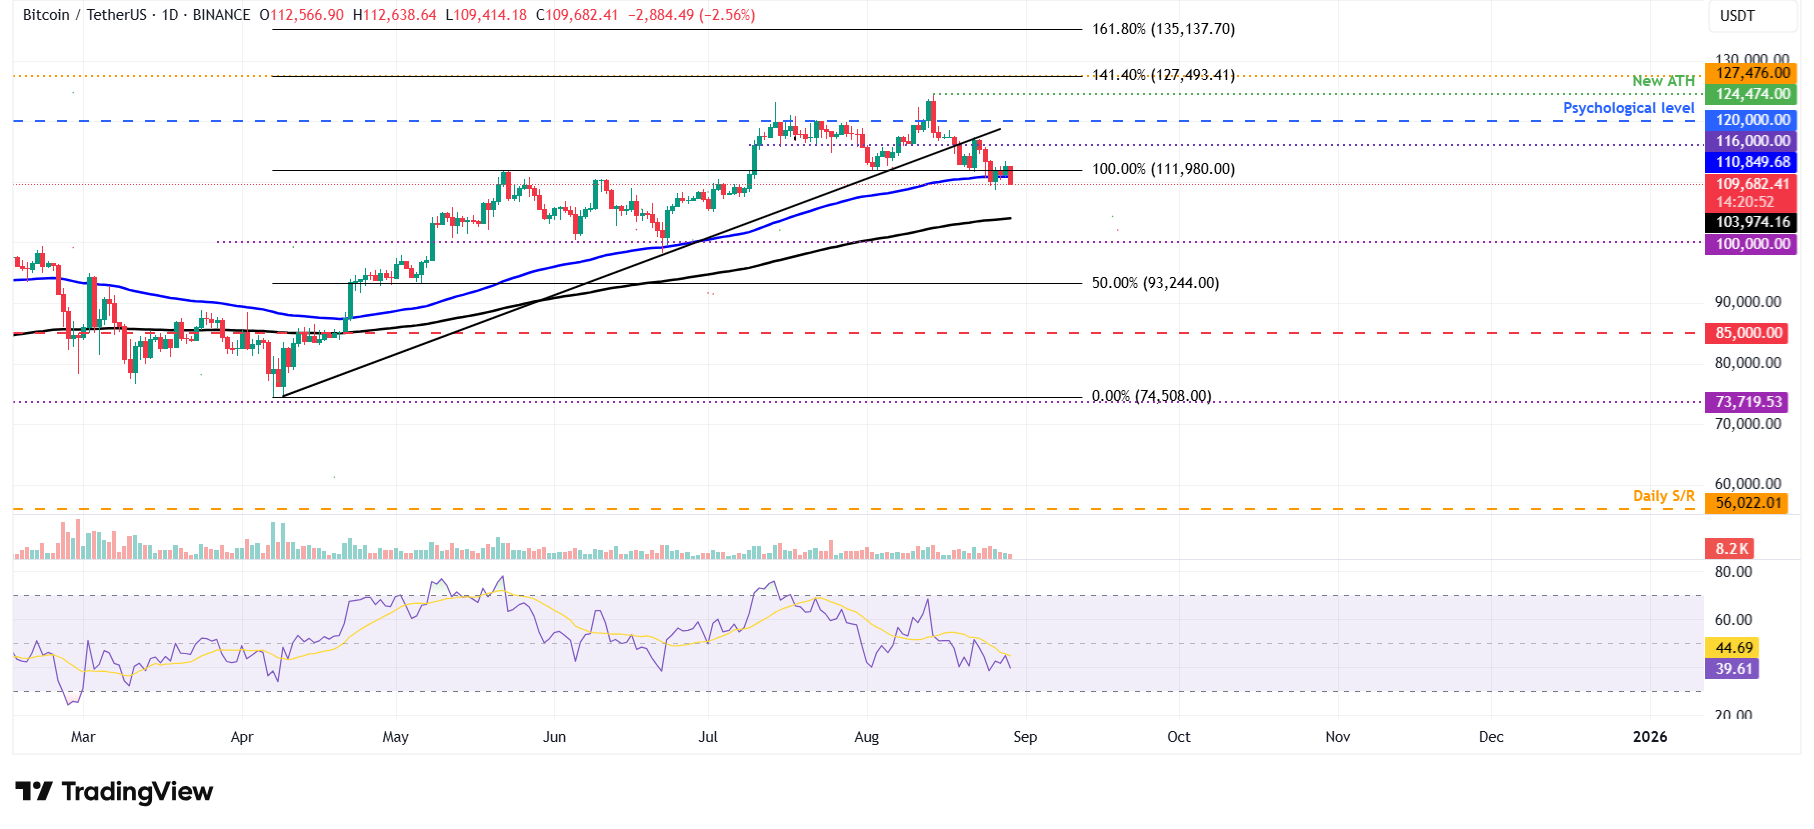
BTC/USDT daily chart
On the other hand, if BTC recovers and the 100-day EMA at $110,849 continues to hold as support, BTC could extend the recovery toward its next daily resistance at $116,000.
Crypto ETF FAQs
An Exchange-Traded Fund (ETF) is an investment vehicle or an index that tracks the price of an underlying asset. ETFs can not only track a single asset, but a group of assets and sectors. For example, a Bitcoin ETF tracks Bitcoin’s price. ETF is a tool used by investors to gain exposure to a certain asset.
Yes. The first Bitcoin futures ETF in the US was approved by the US Securities & Exchange Commission in October 2021. A total of seven Bitcoin futures ETFs have been approved, with more than 20 still waiting for the regulator’s permission. The SEC says that the cryptocurrency industry is new and subject to manipulation, which is why it has been delaying crypto-related futures ETFs for the last few years.
Yes. The SEC approved in January 2024 the listing and trading of several Bitcoin spot Exchange-Traded Funds, opening the door to institutional capital and mainstream investors to trade the main crypto currency. The decision was hailed by the industry as a game changer.
The main advantage of crypto ETFs is the possibility of gaining exposure to a cryptocurrency without ownership, reducing the risk and cost of holding the asset. Other pros are a lower learning curve and higher security for investors since ETFs take charge of securing the underlying asset holdings. As for the main drawbacks, the main one is that as an investor you can’t have direct ownership of the asset, or, as they say in crypto, “not your keys, not your coins.” Other disadvantages are higher costs associated with holding crypto since ETFs charge fees for active management. Finally, even though investing in ETFs reduces the risk of holding an asset, price swings in the underlying cryptocurrency are likely to be reflected in the investment vehicle too.


