


Gold tumbles to its lowest in over a year as Fed rate hike bets build
- Gold falls nearly 2% as growing expectations of higher US interest rates dampen demand.
- Traders await the Fed's October meeting minutes for fresh clues on the policy outlook.
- Technical indicators point to further downside as XAU/USD approaches oversold territory.
Gold (XAU/USD) falls below $3,800 on Wednesday, hitting its lowest level since September 2025 as traders increasingly expect the Federal Reserve (Fed) to keep interest rates higher for longer. At the time of writing, XAU/USD trades around $3,770, down 2% on the day.
Resilient US data and hawkish remarks from Fed officials have strengthened the case for back-to-back rate hikes. A December hike is fully priced in, and traders see around a 70% chance of another increase in January, according to the CME FedWatch Tool. Markets also expect further tightening later in 2027.
Fed hawks lean on solid US data to keep Dollar support intact
Strategists at OCBC highlight that "October data showed solid US momentum heading into 4Q26," with "retail sales rose 0.2% MoM, with the control group up 0.6%, while manufacturing output gained 0.3%." They argue that this combination of resilient consumption and firmer production "supports a 25bp Fed hike in December."
OCBC also underscores that "Fed rhetoric remains hawkish," noting comments from Alberto Musalem that "several rate hikes may be needed before spring 2027," while John Williams "pushed back against a 50bp December move but acknowledged that strong AI investment and demand could require further tightening."
The prospect of additional rate hikes continues to buoy the US Dollar (USD) and keep Treasury yields elevated. The US Dollar Index (DXY), which tracks the Greenback against a basket of six major currencies, reaches 103.80, its highest level since April 2025, while the 10-year US Treasury yield remains comfortably above 5%.
A stronger US Dollar makes Gold more expensive for buyers using other currencies, while higher yields make it less attractive to hold the metal, which pays no interest. Traders now look to the minutes of the Fed’s October meeting, due at 19:00 GMT, for clues on how much support there is for further hikes.
The metal now sits more than 30% below its January record high near $5,600. Much of the pressure comes from a shift in Fed expectations since the US-Iran war began. The conflict pushed energy prices higher, adding to inflation pressure.
Oil prices are currently under pressure as recovering Middle East exports and stronger global supply outweigh concerns about renewed tensions in the Middle East. Still, cheaper Oil offers little relief for Gold as the Fed remains focused on bringing inflation back to its 2% target.
Technical Analysis:
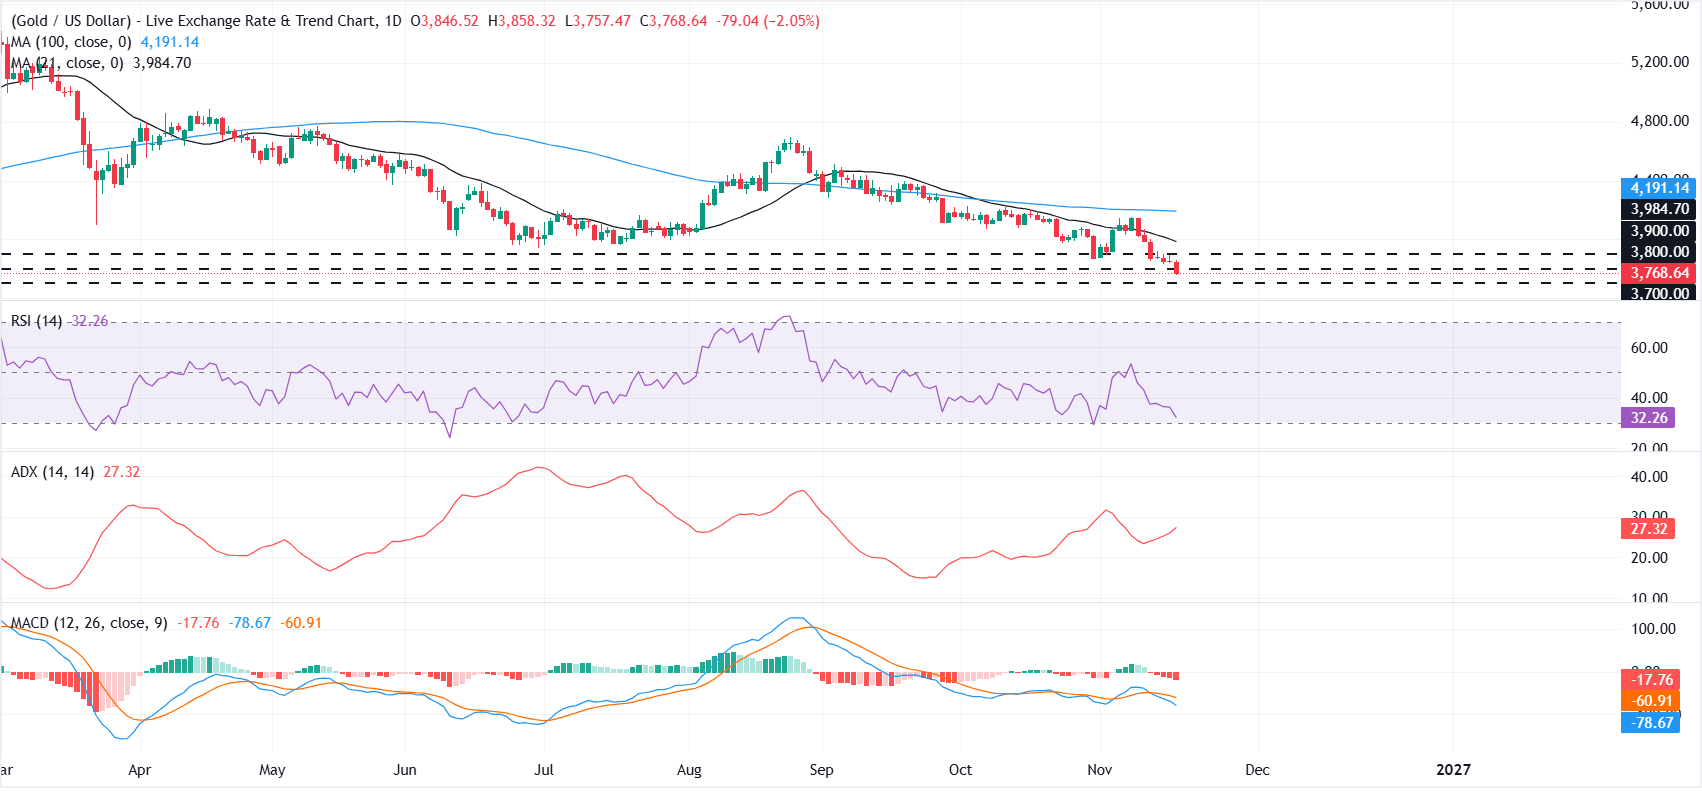
In the daily chart, XAU/USD trades at $3,770.78, extending its decline and holding firmly below both the 21-day simple moving average (SMA) at $3,984.80 and the 100-day SMA at $4,191.16, which together reinforce a dominant bearish bias. The cluster of overhead levels around $3,800.00 and $3,900.00 now acts as immediate resistance, while a negative Moving Average Convergence Divergence (MACD) reading at -17.62 and an Average Directional Index (ADX) near 27.32 suggest a strengthening downside trend, even as the Relative Strength Index (RSI) near 32.35 approaches oversold territory.
On the topside, initial resistance is located at the $3,800.00 horizontal level, followed by $3,900.00, with the 21-day SMA at $3,984.80 and then the 100-day SMA at $4,191.16 marking progressively stronger barriers that bulls would need to reclaim to ease immediate selling pressure. On the downside, the next key support emerges at the horizontal line around $3,700.00; a sustained break below this floor would likely open the way for a deeper bearish extension, while holding above it could allow for a corrective bounce back toward the nearby resistance band.
(The technical analysis of this story was written with the help of an AI tool. Know more.)
추천 기사


