


Silver Price Forecast: XAG/USD plummets to near $52 as Fed’s Waller cautions larger rate hike
- Silver price plunges to near $52.20 as Fed’s Waller warns of bigger interest rate hike.
- The US Dollar draws strength from Fed Waller’s warning of aggressive policy tightening.
- Investors keenly await the US CPI data for October.
Silver price (XAG/USD) is severely down over 2% to near $52.20 during the European trading session. The white metal faces a sharp selling pressure as Federal Reserve (Fed) Governor Christopher Waller has warned of a bigger interest rate hike ahead of the United States (US) Consumer Price Index (CPI) data at 13:30 GMT.
During the European trade, Fed’s Waller said in a speech that further monetary policy tightening is needed and also not rule out the possibility of a larger interest rate hike, if inflationary pressures continue to advance.
“Half-point Fed rate hike may be needed in December, if October core CPI inflation comes in around 0.3% or higher,” Fed’s Waller said.
US inflation expected to cool ahead of key Fed meeting
Economists at Deutsche Bank highlight that, in contrast to September’s strong print, they now anticipate a clear moderation in price pressures. They note that “this time, our US economists expect inflation to have come down from its September pace, with both headline and core at +0.20% on the month,” underscoring expectations for a more subdued October CPI profile going into the next Fed meeting.
Theoretically, fears of aggressive Fed tightening diminish the appeal of non-yielding assets, such as Silver.
The warning of aggressive Fed’s monetary tightening by Governor Christopher Waller has resulted in some relief for the US Dollar (USD). Following Waller’s remarks, the US Dollar Index (DXY), which gauges the Greenback’s value against six major currencies, clawed back its early losses and turned marginally positive above 101.70.
Silver Technical Analysis
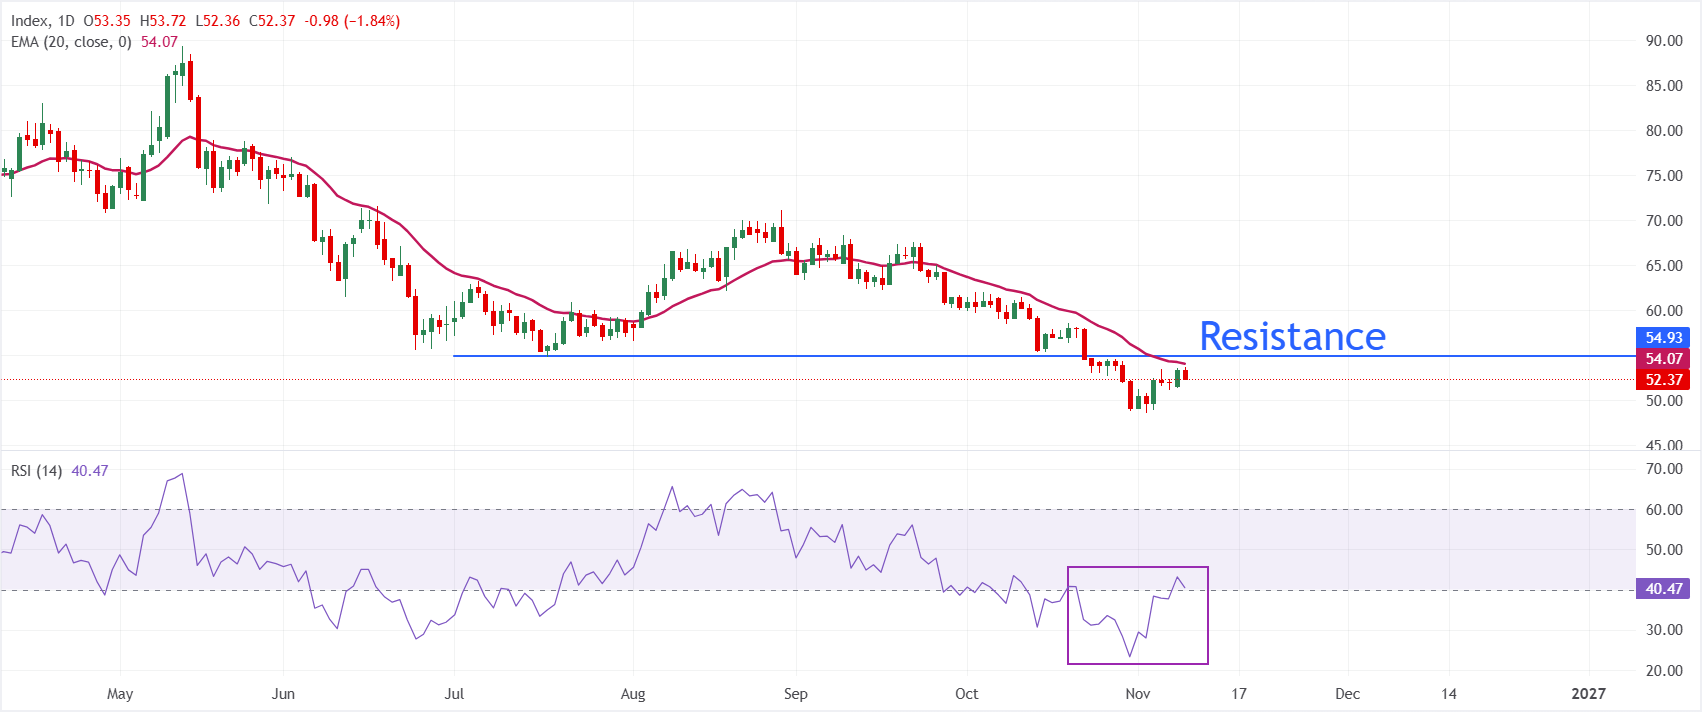
In the daily chart, XAG/USD trades at $52.36, maintaining a bearish near-term tone as it holds below the 20-day Exponential Moving Average (EMA) at $54.07. The short-term trend remains pressured while price stays capped under this dynamic barrier, and the Relative Strength Index (14) around 40 suggests weak but not oversold momentum, hinting that sellers still retain an advantage.
On the topside, the 20-day EMA at $54.07 is the first notable resistance, and a daily close above this level would be needed to ease immediate downside pressure and open the way for a corrective recovery. With no nearby technical supports highlighted by the current dataset, any further pullback from present levels would leave XAG/USD vulnerable to probing lower chart-based levels not captured here, keeping focus on whether buyers can reclaim the $54 area to stabilize the outlook.
(The technical analysis of this story was written with the help of an AI tool. Know more.)
Economic Indicator
Consumer Price Index ex Food & Energy (MoM)
Inflationary or deflationary tendencies are measured by periodically summing the prices of a basket of representative goods and services and presenting the data as the Consumer Price Index (CPI). CPI data is compiled on a monthly basis and released by the US Department of Labor Statistics. The MoM print compares the prices of goods in the reference month to the previous month.The CPI Ex Food & Energy excludes the so-called more volatile food and energy components to give a more accurate measurement of price pressures. Generally speaking, a high reading is seen as bullish for the US Dollar (USD), while a low reading is seen as bearish.
Read more.Next release: Tue Nov 10, 2026 13:30
Frequency: Monthly
Consensus: 0.2%
Previous: 0.3%
Source: US Bureau of Labor Statistics
The US Federal Reserve has a dual mandate of maintaining price stability and maximum employment. According to such mandate, inflation should be at around 2% YoY and has become the weakest pillar of the central bank’s directive ever since the world suffered a pandemic, which extends to these days. Price pressures keep rising amid supply-chain issues and bottlenecks, with the Consumer Price Index (CPI) hanging at multi-decade highs. The Fed has already taken measures to tame inflation and is expected to maintain an aggressive stance in the foreseeable future.
추천 기사


