


Crude Oil round-trips between a rejected Iran plan and a sanctions offer
- WTI spikes toward $95.00 on Trump's Iran rejection, then slips back near $91.50.
- Saudi East-West pipeline flows back near 3.5 million barrels a day, half its capacity.
- 132 ships through Hormuz in the week to September 27, up from 116.
President Trump's rejection of Iran's seven-day plan for the Strait of Hormuz lifted Crude Oil to its best level since Thursday, and the whole rise was gone after a Saudi pipeline restart and a US offer of sanctions relief. Crude Oil sits near $91.50, back where Friday's session left it, which puts the net value of a weekend of diplomacy and a restarted pipeline at zero so far.
Both sides want the same deal in the opposite order
Iran's plan reopens the strait at the end of seven days if Washington first lifts its naval blockade of Iranian ports, drops sanctions on Iranian barrels and releases frozen assets, with nuclear talks to follow. President Trump called it unacceptable on Saturday, and US Ambassador to the United Nations Waltz said Tehran was asking for everything up front. In an interview on Sunday, President Trump said the terms were ones Washington might have accepted about a year ago, when there was no war, no blockade and no strait to reopen.
On Monday a US official said President Trump is prepared to ease sanctions and release frozen assets in exchange for concrete nuclear progress, and that the two sides are apart on timing and on who moves first. Either order ends with Iranian barrels back on the water and more tankers through Hormuz, which is the downside for Crude Oil. That's why the price moves on whichever side looks closer to going first rather than on whether a deal exists.
Iran's nuclear offer has three versions since Friday
A senior Iranian official said on Friday there would be no nuclear flexibility even if Washington accepted the plan. Sources the same day described an offer to send Iran's most enriched uranium to a third country, and a Saudi broadcaster reported on Monday, citing sources, that Iran has agreed to halt enrichment in exchange for sanctions relief. A halt is the step that would unlock relief and put Iran's exports back in play, so it's the version that matters most for Crude Oil and the one with the thinnest sourcing. Iran's Foreign Minister Araghchi said on Sunday that the country is fully prepared for the war to resume.
Hormuz moved a pre-war day's traffic in a week
Saudi Arabia resumed exports through its East-West pipeline to the Red Sea port of Yanbu on Monday, ending a 17-day halt after drone damage earlier in the month. Flows are near 3.5 million barrels a day against capacity of about 7 million, and those barrels reach buyers without passing Hormuz or waiting on anyone in Washington or Tehran. A full return could take about six weeks, which lands in the week after the midterms.
Saudi Arabia also sent more cargoes through the strait itself, taking total exports to a wartime high above 5 million barrels a day in September. Ship-tracking data counted 132 transits of Hormuz in the week to September 27, up from 116 the week before, against roughly 130 a day before the war began on February 28. Every extra cargo that reaches a refiner lowers what the next one is worth, and that erodes the premium Crude Oil carries for a strait that is still mostly shut.
The end of the war and the next round of strikes share a date
President Trump said earlier in September that the conflict should end soon after the November 3 midterms, with prices falling right after the vote. A US newspaper reported on Friday that he has told aides he expects strikes on Iran to resume after the election, and Ambassador Waltz called that anonymous reporting. Iranian officials were reported on Monday to be pessimistic about a deal before the midterms, while Iran's President Pezeshkian said on Thursday that Tehran wants one before the vote.
That gives the risk premium in Crude Oil an expiry date and no direction. A signed deal after November 3 takes it out, and a resumed bombing campaign on the same timetable puts more in. Until then each headline reprices the odds of one branch against the other, and a session that has run both ways and come back to Friday's level is about as accurate a reading of those odds as the market can offer.
Levels and bias
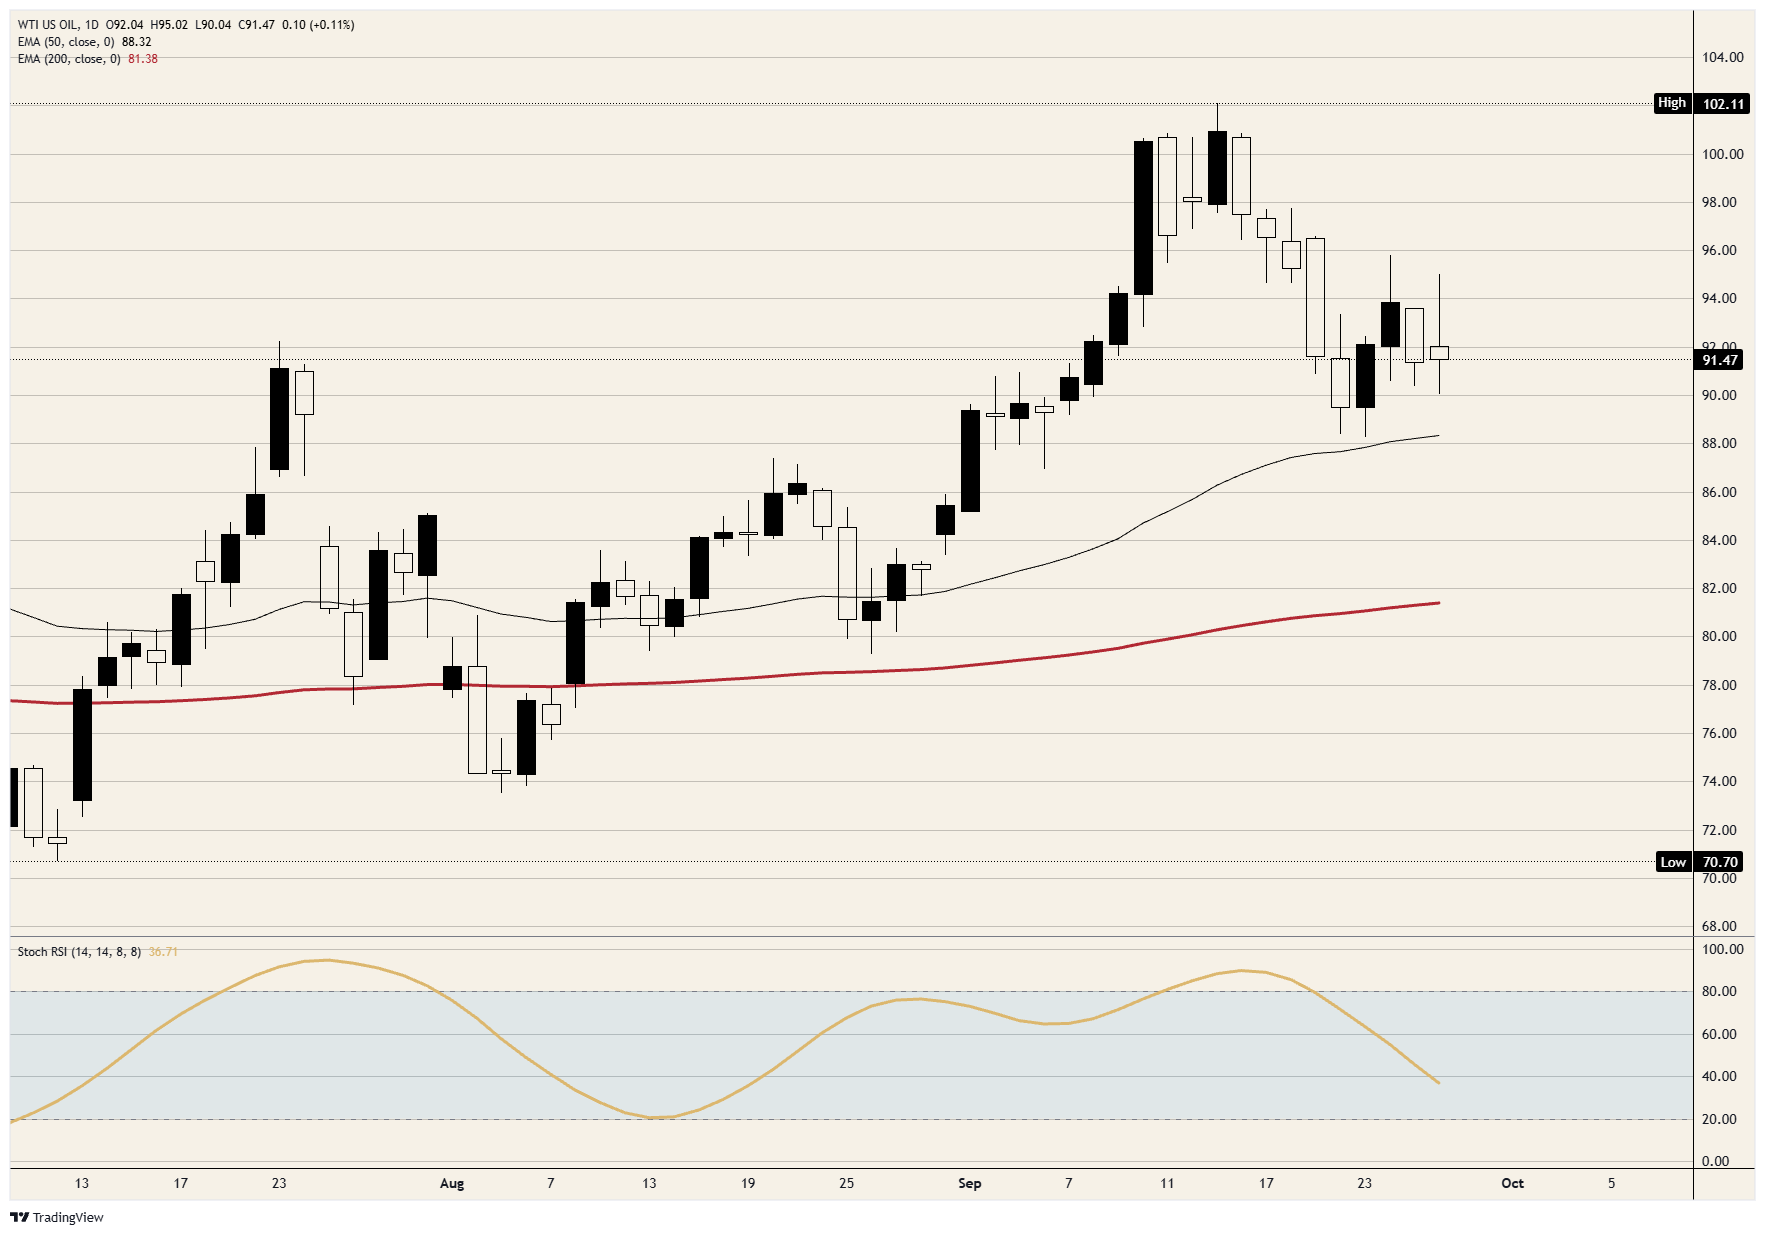
Resistance: Crude Oil sold off from just above $93.50 on Friday and never got back to it. Monday's spike stopped just above $95.00, short of Thursday's high near $96.00, and every rally since the September 15 peak near $102.00 has stopped lower than the one before it.
Support: Monday's low just above $90.00 comes first. Beneath it, the $88.50 area held on September 22 and September 23, and the 50-day Exponential Moving Average (EMA) has risen into the same spot, so a break there takes out both.
Bias: The lean is short while $95.00 caps, with $90.00 the first objective and the $88.50 floor the second. The daily Stochastic Relative Strength Index (Stoch RSI) is near 37 and still falling from above 80, so momentum has room left before the bottom of its range. A daily close above $96.00 ends the short case.
WTI daily chart
WTI Oil FAQs
WTI Oil is a type of Crude Oil sold on international markets. The WTI stands for West Texas Intermediate, one of three major types including Brent and Dubai Crude. WTI is also referred to as “light” and “sweet” because of its relatively low gravity and sulfur content respectively. It is considered a high quality Oil that is easily refined. It is sourced in the United States and distributed via the Cushing hub, which is considered “The Pipeline Crossroads of the World”. It is a benchmark for the Oil market and WTI price is frequently quoted in the media.
Like all assets, supply and demand are the key drivers of WTI Oil price. As such, global growth can be a driver of increased demand and vice versa for weak global growth. Political instability, wars, and sanctions can disrupt supply and impact prices. The decisions of OPEC, a group of major Oil-producing countries, is another key driver of price. The value of the US Dollar influences the price of WTI Crude Oil, since Oil is predominantly traded in US Dollars, thus a weaker US Dollar can make Oil more affordable and vice versa.
The weekly Oil inventory reports published by the American Petroleum Institute (API) and the Energy Information Agency (EIA) impact the price of WTI Oil. Changes in inventories reflect fluctuating supply and demand. If the data shows a drop in inventories it can indicate increased demand, pushing up Oil price. Higher inventories can reflect increased supply, pushing down prices. API’s report is published every Tuesday and EIA’s the day after. Their results are usually similar, falling within 1% of each other 75% of the time. The EIA data is considered more reliable, since it is a government agency.
OPEC (Organization of the Petroleum Exporting Countries) is a group of 12 Oil-producing nations who collectively decide production quotas for member countries at twice-yearly meetings. Their decisions often impact WTI Oil prices. When OPEC decides to lower quotas, it can tighten supply, pushing up Oil prices. When OPEC increases production, it has the opposite effect. OPEC+ refers to an expanded group that includes ten extra non-OPEC members, the most notable of which is Russia.
추천 기사


