


Gold slides nearly 3% as Fed hike bets, rising Treasury yields weigh
- Gold falls nearly 3% as traders weigh rising Oil prices, higher US yields and the prospect of another Fed rate hike.
- A busy week of US data and Fed commentary puts the spotlight on inflation, employment and the Fed’s next move.
- XAU/USD trades below its 50-day, 100-day and 200-day moving averages, while the RSI approaches oversold territory.
Gold (XAU/USD) starts the week under heavy selling pressure, sliding nearly 3% as Oil-driven inflation concerns reinforce expectations that the Federal Reserve (Fed) could raise interest rates further. At the time of writing, XAU/USD trades around $4,156, its lowest level since August 5.
Oil prices have remained volatile since late February, when the United States (US) and Israel launched joint strikes on Iran, triggering a war in the Middle East and disrupting supplies through the Strait of Hormuz.
Over the weekend, US President Donald Trump rejected Iran’s latest proposal to reopen the strait within seven days. However, he told Axios on Sunday that he expects US negotiators to hold further talks this week. Iran’s Foreign Minister Abbas Araghchi insisted that Tehran would not back down from its demands, which include sanctions relief, access to frozen assets and an end to the US blockade.
With both sides maintaining uncompromising stances, the prospects for a quick diplomatic breakthrough remain slim, even as they leave the door open to more talks.
Gold has gained little from its traditional role as a safe-haven asset and inflation hedge since the outbreak of the war. The precious metal is down about 25% from its January all-time high near $5,600, with interest-rate expectations remaining the main driver. Elevated Oil prices have pushed global bond yields to multi-year highs, increasing the opportunity cost of holding non-yielding metal. The 10-year US Treasury yield advances to 5.23%, its highest level since 2007.
Traders are pricing in additional monetary policy tightening by the Fed after the central bank delivered a 25-basis-point (bps) hike at its September 15-16 meeting, its first in three years. Following a series of hawkish comments from Fed officials last week, markets see a 70% chance of a rate hike in October, according to CME FedWatch.
The hawkish Fed outlook and rising Treasury yields keep the US Dollar near recent highs, adding further pressure on Gold. The US Dollar Index (DXY), which tracks the Greenback’s value against a basket of six major currencies, trades around 101.16.
A packed US economic calendar could give Gold fresh direction this week. Traders will assess Personal Consumption Expenditures (PCE) inflation due Wednesday, the ISM Purchasing Managers’ Index (PMI) on Thursday and Nonfarm Payrolls (NFP) on Friday, as well as comments from Fed officials, for clues on the central bank’s next move.
Technical Analysis: Bears retain control below key moving averages
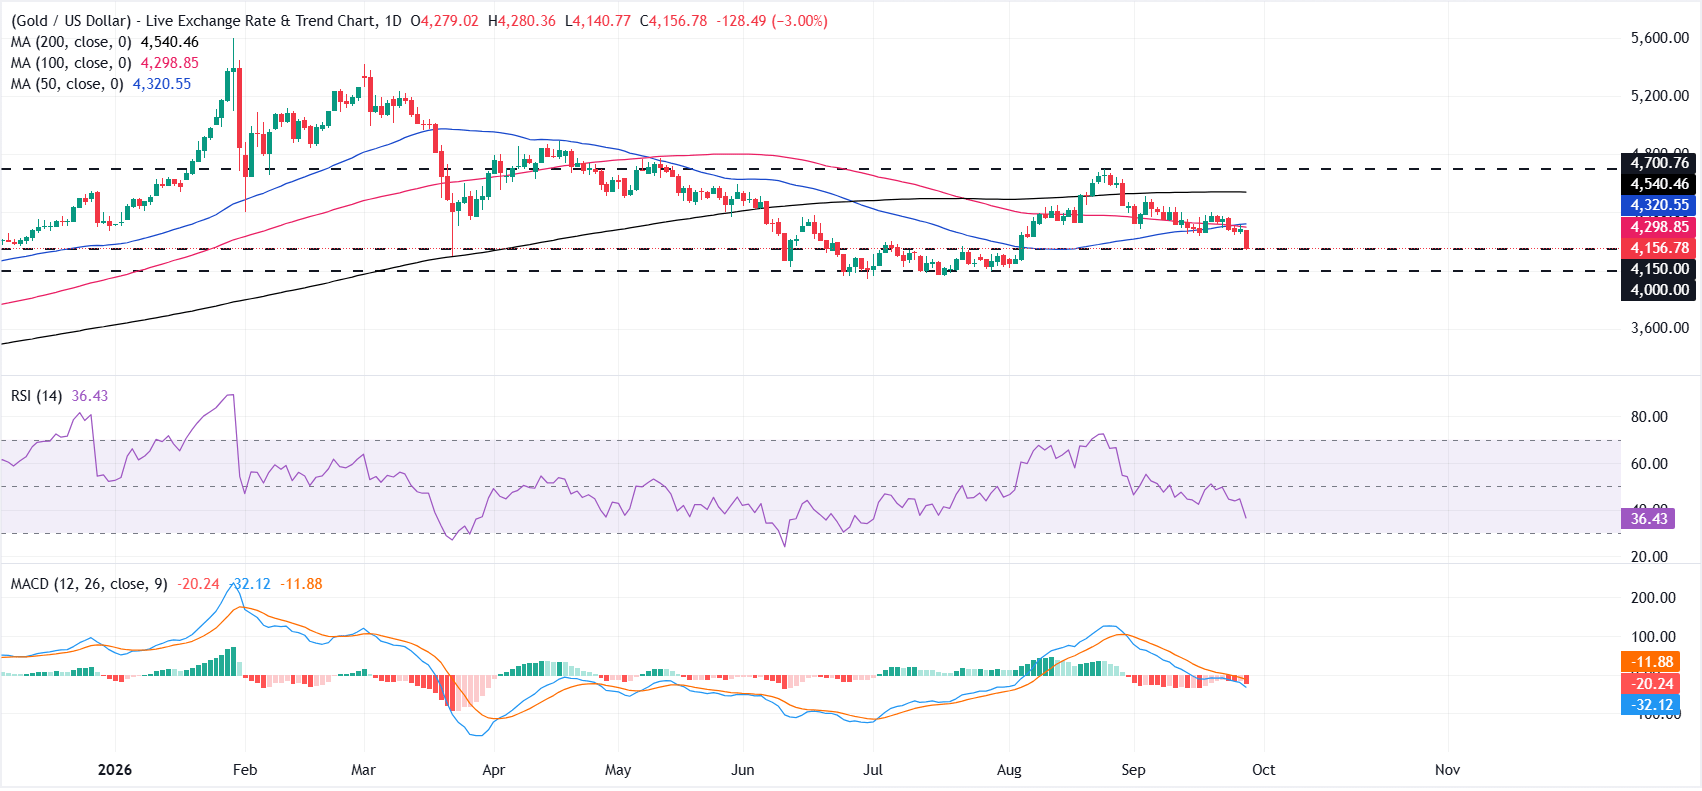
On the daily chart, XAU/USD keeps a bearish near-term bias as price holds below the 50-day and 100-day Simple Moving Averages (SMA), while the longer-term 200-day SMA remains further overhead.
Momentum reinforces the downside tone, with the Relative Strength Index (RSI) slipping toward oversold territory at 36 and the Moving Average Convergence Divergence (MACD) indicator firmly below zero, hinting that rallies are likely to be capped by the clustered moving-average resistance.
On the topside, initial resistance aligns with the 100-day SMA at $4,298, followed by the 50-day SMA at $4,320, both capping recovery attempts before the more distant 200-day SMA at $4,540. A higher barrier emerges at the horizontal resistance level at $4,700.
On the downside, immediate support is seen at the horizontal floor around $4,150, with a deeper cushion near $4,000. A clean break below these levels would open the door to an extension of the current bearish phase.
(The technical analysis of this story was written with the help of an AI tool. Know more.)
Gold FAQs
Gold has played a key role in human’s history as it has been widely used as a store of value and medium of exchange. Currently, apart from its shine and usage for jewelry, the precious metal is widely seen as a safe-haven asset, meaning that it is considered a good investment during turbulent times. Gold is also widely seen as a hedge against inflation and against depreciating currencies as it doesn’t rely on any specific issuer or government.
Central banks are the biggest Gold holders. In their aim to support their currencies in turbulent times, central banks tend to diversify their reserves and buy Gold to improve the perceived strength of the economy and the currency. High Gold reserves can be a source of trust for a country’s solvency. Central banks added 1,136 tonnes of Gold worth around $70 billion to their reserves in 2022, according to data from the World Gold Council. This is the highest yearly purchase since records began. Central banks from emerging economies such as China, India and Turkey are quickly increasing their Gold reserves.
Gold has an inverse correlation with the US Dollar and US Treasuries, which are both major reserve and safe-haven assets. When the Dollar depreciates, Gold tends to rise, enabling investors and central banks to diversify their assets in turbulent times. Gold is also inversely correlated with risk assets. A rally in the stock market tends to weaken Gold price, while sell-offs in riskier markets tend to favor the precious metal.
The price can move due to a wide range of factors. Geopolitical instability or fears of a deep recession can quickly make Gold price escalate due to its safe-haven status. As a yield-less asset, Gold tends to rise with lower interest rates, while higher cost of money usually weighs down on the yellow metal. Still, most moves depend on how the US Dollar (USD) behaves as the asset is priced in dollars (XAU/USD). A strong Dollar tends to keep the price of Gold controlled, whereas a weaker Dollar is likely to push Gold prices up.
추천 기사


