

GBP/JPY trades near multi-month highs with bullish trend intact
- GBP/JPY trades just below year-to-date highs near 198.35 in the late American session.
- The pair remains supported within a rising channel, with a trend structure that is the firmly bullish.
- Immediate resistance seen at 199.00 and the December 2024 high at 198.96.
The British Pound (GBP) strengthens against the Japanese Yen (JPY) on Wednesday after posting minimal losses on Tuesday, extending its bullish momentum near YTD highs. GBP/JPY is trading on the front foot since last week, supported by broad Yen weakness and firm demand for the Pound amid diverging monetary policy outlooks.
At the time of writing, GBP/JPY is trading just shy of its year-to-date highs around the 198.35 mark during the late American session. That said, the Yen is broadly weaker across the board, weighed down by the Bank of Japan’s latest Summary of Opinions, which reflected a cautious stance on further policy tightening. The central bank's reluctance to commit to a clear rate hike timeline — despite signs of sticky inflation — has reinforced the policy divergence narrative, keeping the Yen on the defensive.
In the UK, Bank of England (BoE) Governor Andrew Bailey and Deputy Governor Dave Ramsden reinforced the view that interest rates are likely to fall in the coming months, citing signs of slack in the labor market. Bailey noted slowing wage growth and rising economic inactivity as evidence of easing inflationary pressures, though he also expressed concern over the reliability of labor data. Despite these dovish undertones, market participants still anticipate a cautious easing path, keeping underlying support for the Pound intact.
This divergence in monetary policy has created a significant yield differential, making the Pound more attractive to investors. The higher interest rates in the UK support carry trade flows that favor GBP over the low-yielding Yen, putting upward pressure on the GBP/JPY exchange rate.
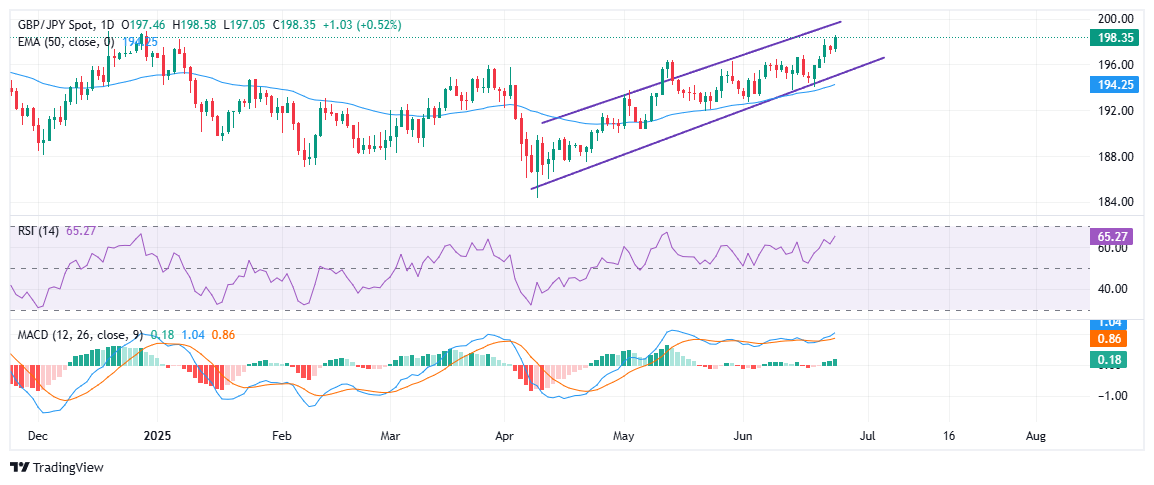
From a technical standpoint, GBP/JPY remains comfortably within a rising parallel channel, with bullish structure intact. The pair has been carving higher highs and higher lows since mid-April and continues to trade well above the 50-day Exponential Moving Average (EMA), currently around 194.25. This level has consistently acted as dynamic support.
Momentum indicators support the bullish outlook. The Relative Strength Index (RSI) stands near 65, trending upward but not yet in overbought territory, leaving room for further gains. Meanwhile, the Moving Average Convergence Divergence (MACD) histogram is expanding after a recent bullish crossover, reinforcing the upside bias.
Immediate resistance is seen at the upper boundary of the ascending channel and the 199.00 round figure, just below the December 30, 2024 swing high at 198.96. A clean break above this zone would mark a fresh yearly high and could pave the way for a run toward 200.00 and beyond. On the downside, initial support lies near 196.00 (channel midline), followed by the 50-day EMA. As long as the pair remains above these levels, the path of least resistance stays to the upside.
추천 기사


