
GBP/JPY Price Forecast: Sticks to strong intraday gains below 196.00 amid notable JPY weakness
- GBP/JPY jumps back closer to the multi-month top in reaction to the tariffs-block news.
- BoJ rate hike bets and the prevalent GBP selling bias keep a lid on any further gains.
- The setup favors bulls and supports prospects for a further near-term appreciation.
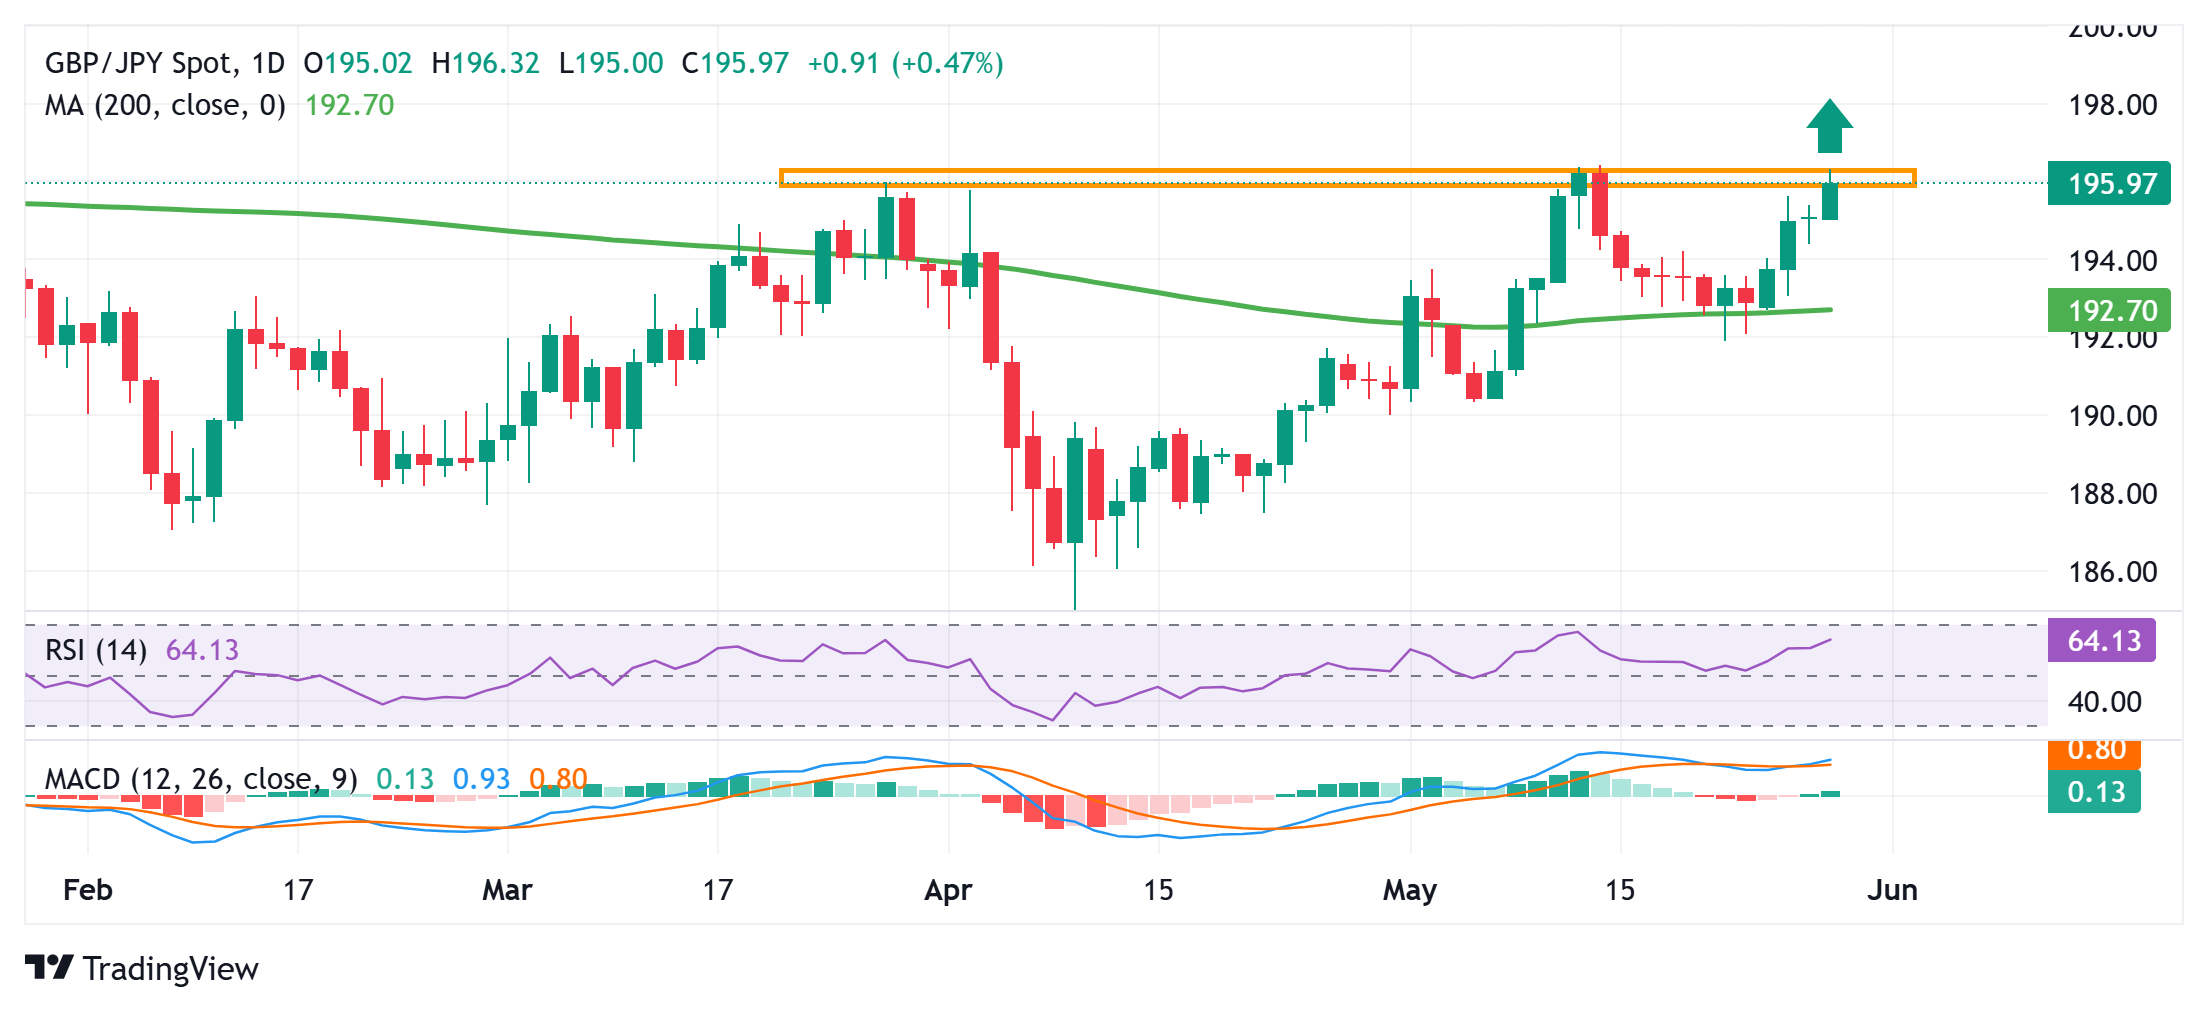
The GBP/JPY cross prolonged its weekly uptrend for the fourth straight day on Thursday and climbed to the 196.30 area during the Asian session, back closer to a multi-month peak touched earlier this May. Spot prices, however, retreat around 50 pips from the daily swing high and currently trade around the 195.85-195.80 region, up 0.40% for the day.
The US tariffs-block news led to a sharp bounce in risk trade and weighs heavily on the safe-haven Japanese Yen (JPY), which, in turn, assists the GBP/JPY cross to attract some follow-through buying. However, expectations that the Bank of Japan (BoJ) will continue raising interest rates help limit JPY losses. Furthermore, a broadly stronger US Dollar (USD) weighs on the British Pound (GBP) and contributes to capping the currency pair.
From a technical perspective, the GBP/JPY cross recently showed some resilience below the very important 200-day Simple Moving Average (SMA). The subsequent move-up and positive oscillators on the daily chart suggest that the path of least resistance for spot prices remains to the upside. However, bulls might wait for a sustained strength beyond the monthly swing high, around the 196.40 area, before placing fresh bets.
The GBP/JPY cross might then aim to reclaim the 197.00 round figure for the first time since January. The momentum could extend further towards the 197.40-197.50 intermediate hurdle en route to the 198.00 mark and the 198.25 region, or the year-to-date high. Some follow-through buying will be seen as a fresh trigger for bullish traders and pave the way for an extension of the recent uptrend witnessed over the past two months or so.
On the flip side, any further pullback could find some support and attract some dip-buyers near the 195.50-195.40 horizontal zone, which, in turn, should help limit the downside for the GBP/JPY cross near the 195.00 psychological mark. Some follow-through selling below the Asian session low, around the 194.85 region, might trigger some long-unwinding and drag spot prices to the 194.40-194.35 intermediate support en route to the 194.00 mark.
GBP/JPY daily chart
Japanese Yen PRICE Today
The table below shows the percentage change of Japanese Yen (JPY) against listed major currencies today. Japanese Yen was the strongest against the Swiss Franc.
| USD | EUR | GBP | JPY | CAD | AUD | NZD | CHF | |
|---|---|---|---|---|---|---|---|---|
| USD | 0.45% | 0.28% | 0.69% | 0.11% | 0.05% | 0.45% | 0.74% | |
| EUR | -0.45% | -0.16% | 0.25% | -0.34% | -0.33% | -0.00% | 0.28% | |
| GBP | -0.28% | 0.16% | 0.41% | -0.17% | -0.16% | 0.15% | 0.36% | |
| JPY | -0.69% | -0.25% | -0.41% | -0.61% | -0.67% | -0.30% | -0.07% | |
| CAD | -0.11% | 0.34% | 0.17% | 0.61% | -0.11% | 0.35% | 0.52% | |
| AUD | -0.05% | 0.33% | 0.16% | 0.67% | 0.11% | 0.34% | 0.51% | |
| NZD | -0.45% | 0.00% | -0.15% | 0.30% | -0.35% | -0.34% | 0.18% | |
| CHF | -0.74% | -0.28% | -0.36% | 0.07% | -0.52% | -0.51% | -0.18% |
The heat map shows percentage changes of major currencies against each other. The base currency is picked from the left column, while the quote currency is picked from the top row. For example, if you pick the Japanese Yen from the left column and move along the horizontal line to the US Dollar, the percentage change displayed in the box will represent JPY (base)/USD (quote).
추천 기사


