

AUD/JPY Price Forecast: Consolidates above 100.00 after turning bullish
- AUD/JPY remains neutral but holds above 100.00, supported by risk-on sentiment and weakness in the Yen against the US Dollar.
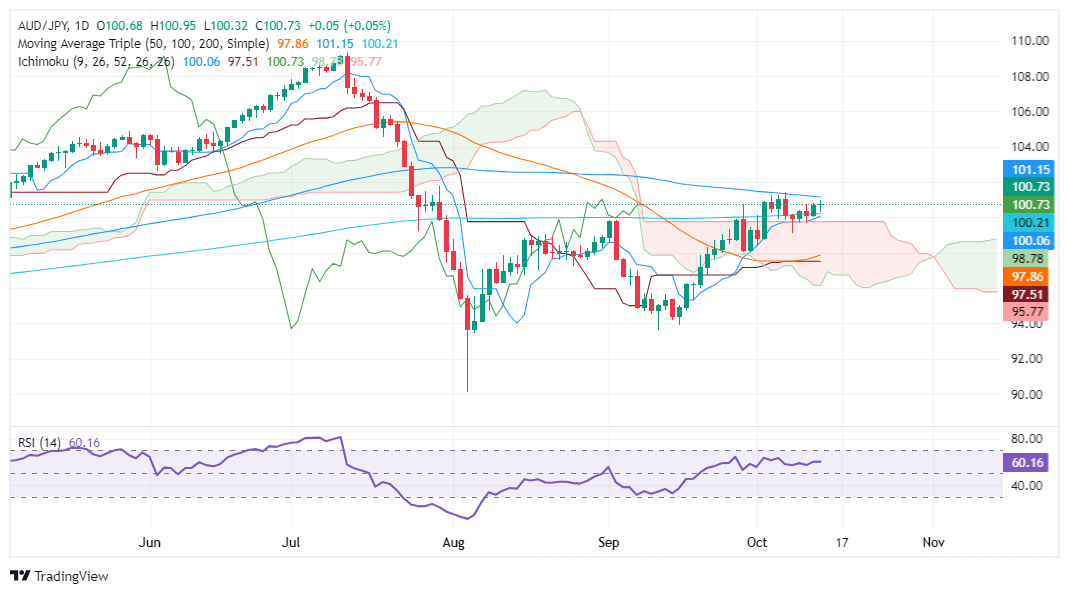
- If the pair clears 101.40, it could target further upside toward 102.00 and 102.50, with potential resistance at 103.00.
- A drop below 100.00 would bring support at the top of the Ichimoku Cloud around 99.70/80, with additional support at 98.77.
The AUD/JPY consolidates at around 100.30 yet posts minuscule gains of over 0.06% at the time of writing. A risk-on impulse keeps the Australian Dollar from posting losses against the Japanese Yen, which loses some ground against the US Dollar.
AUD/JPY Price Forecast: Technical outlook
The AUD/JPY is neutral biased, though it has broken the 100.00 barrier. This opened the door for the cross-pair to trade within the 100.00-101.40 range, with further upside eyed.
Now that buyers have lifted the exchange rate above the Ichimoku Cloud (Kumo), the pair could test the year-to-date (YTD) peak at 109.37.
The momentum remains bullish and slightly consolidated, as shown by the Relative Strength Index (RSI).
If AUD/JPY surpassed the October 7 high at 101.40, it opened the door to challenge 102.00. On further strength, the AUD/JPY's next resistance would be 102.50, ahead of challenging the 103.00 mark
Conversely, if the cross-pair drops below 100.00, the first support would be the top of the Kumo at 99.70/80. Once cleared, the next support would be Senkou Span A at 98.77.
AUD/JPY Price Action – Daily Chart
Australian Dollar FAQs
One of the most significant factors for the Australian Dollar (AUD) is the level of interest rates set by the Reserve Bank of Australia (RBA). Because Australia is a resource-rich country another key driver is the price of its biggest export, Iron Ore. The health of the Chinese economy, its largest trading partner, is a factor, as well as inflation in Australia, its growth rate and Trade Balance. Market sentiment – whether investors are taking on more risky assets (risk-on) or seeking safe-havens (risk-off) – is also a factor, with risk-on positive for AUD.
The Reserve Bank of Australia (RBA) influences the Australian Dollar (AUD) by setting the level of interest rates that Australian banks can lend to each other. This influences the level of interest rates in the economy as a whole. The main goal of the RBA is to maintain a stable inflation rate of 2-3% by adjusting interest rates up or down. Relatively high interest rates compared to other major central banks support the AUD, and the opposite for relatively low. The RBA can also use quantitative easing and tightening to influence credit conditions, with the former AUD-negative and the latter AUD-positive.
China is Australia’s largest trading partner so the health of the Chinese economy is a major influence on the value of the Australian Dollar (AUD). When the Chinese economy is doing well it purchases more raw materials, goods and services from Australia, lifting demand for the AUD, and pushing up its value. The opposite is the case when the Chinese economy is not growing as fast as expected. Positive or negative surprises in Chinese growth data, therefore, often have a direct impact on the Australian Dollar and its pairs.
Iron Ore is Australia’s largest export, accounting for $118 billion a year according to data from 2021, with China as its primary destination. The price of Iron Ore, therefore, can be a driver of the Australian Dollar. Generally, if the price of Iron Ore rises, AUD also goes up, as aggregate demand for the currency increases. The opposite is the case if the price of Iron Ore falls. Higher Iron Ore prices also tend to result in a greater likelihood of a positive Trade Balance for Australia, which is also positive of the AUD.
The Trade Balance, which is the difference between what a country earns from its exports versus what it pays for its imports, is another factor that can influence the value of the Australian Dollar. If Australia produces highly sought after exports, then its currency will gain in value purely from the surplus demand created from foreign buyers seeking to purchase its exports versus what it spends to purchase imports. Therefore, a positive net Trade Balance strengthens the AUD, with the opposite effect if the Trade Balance is negative.
추천 기사


