


0.6900: A key level to watch for AUD/USD amid Head and Shoulders formation
- AUD/USD jumps to near 0.6950 due to upbeat Australian Dollar.
- The upside in the antipodean seems capped amid soft Australian job data.
- Weakness in the US Dollar has also supported the Aussie pair.
The Australian Dollar (AUD) is up 0.41% higher at around 0.6950 against the US Dollar (USD) during the European trading session on Friday. The Aussie pair strengthens as the market sentiment turns risk-on due to United States (US) Treasury Yields remaining under pressure this week.
Australian Dollar Price Today
The table below shows the percentage change of Australian Dollar (AUD) against listed major currencies today. Australian Dollar was the strongest against the US Dollar.
| USD | EUR | GBP | JPY | CAD | AUD | NZD | CHF | |
|---|---|---|---|---|---|---|---|---|
| USD | -0.24% | -0.36% | -0.06% | -0.16% | -0.57% | -0.73% | -0.27% | |
| EUR | 0.24% | -0.13% | 0.12% | 0.06% | -0.32% | -0.51% | -0.03% | |
| GBP | 0.36% | 0.13% | 0.29% | 0.21% | -0.21% | -0.38% | 0.09% | |
| JPY | 0.06% | -0.12% | -0.29% | -0.06% | -0.48% | -0.61% | -0.19% | |
| CAD | 0.16% | -0.06% | -0.21% | 0.06% | -0.41% | -0.62% | -0.12% | |
| AUD | 0.57% | 0.32% | 0.21% | 0.48% | 0.41% | -0.17% | 0.32% | |
| NZD | 0.73% | 0.51% | 0.38% | 0.61% | 0.62% | 0.17% | 0.48% | |
| CHF | 0.27% | 0.03% | -0.09% | 0.19% | 0.12% | -0.32% | -0.48% |
The heat map shows percentage changes of major currencies against each other. The base currency is picked from the left column, while the quote currency is picked from the top row. For example, if you pick the Australian Dollar from the left column and move along the horizontal line to the US Dollar, the percentage change displayed in the box will represent AUD (base)/USD (quote).
As of writing, S&P 500 futures are up 0.12% to near 7,750, reflecting improved risk appetite among investors. 10-year US Treasury Yields are down to near 5.07%, closer to their over three-week low of 5.04% posted on Thursday.
However, the upside in the Australian Dollar could be capped by growing doubts about whether the Reserve Bank of Australia (RBA) will hike interest rates in the November meeting.
Hawkish RBA expectations have come under pressure after the release of the Australian employment data for September on Thursday, which showed a decline in the overall laborforce.
Analysts at Rabobank highlight a weaker tone in Australia’s latest labour figures, noting that “the unemployment rate printing at 4.6% and a contraction of almost 40 thousand jobs” is effectively “erasing the job gains seen in July.”
Rabobank added, “The bank characterises the September data as setting a softer backdrop for policy discussions, with the labour market losing momentum after earlier gains.”
Meanwhile, the weakness in the US Dollar due to lower US Treasury Yields has also lent support to the Aussie pair.
AUD/USD Technical Analysis
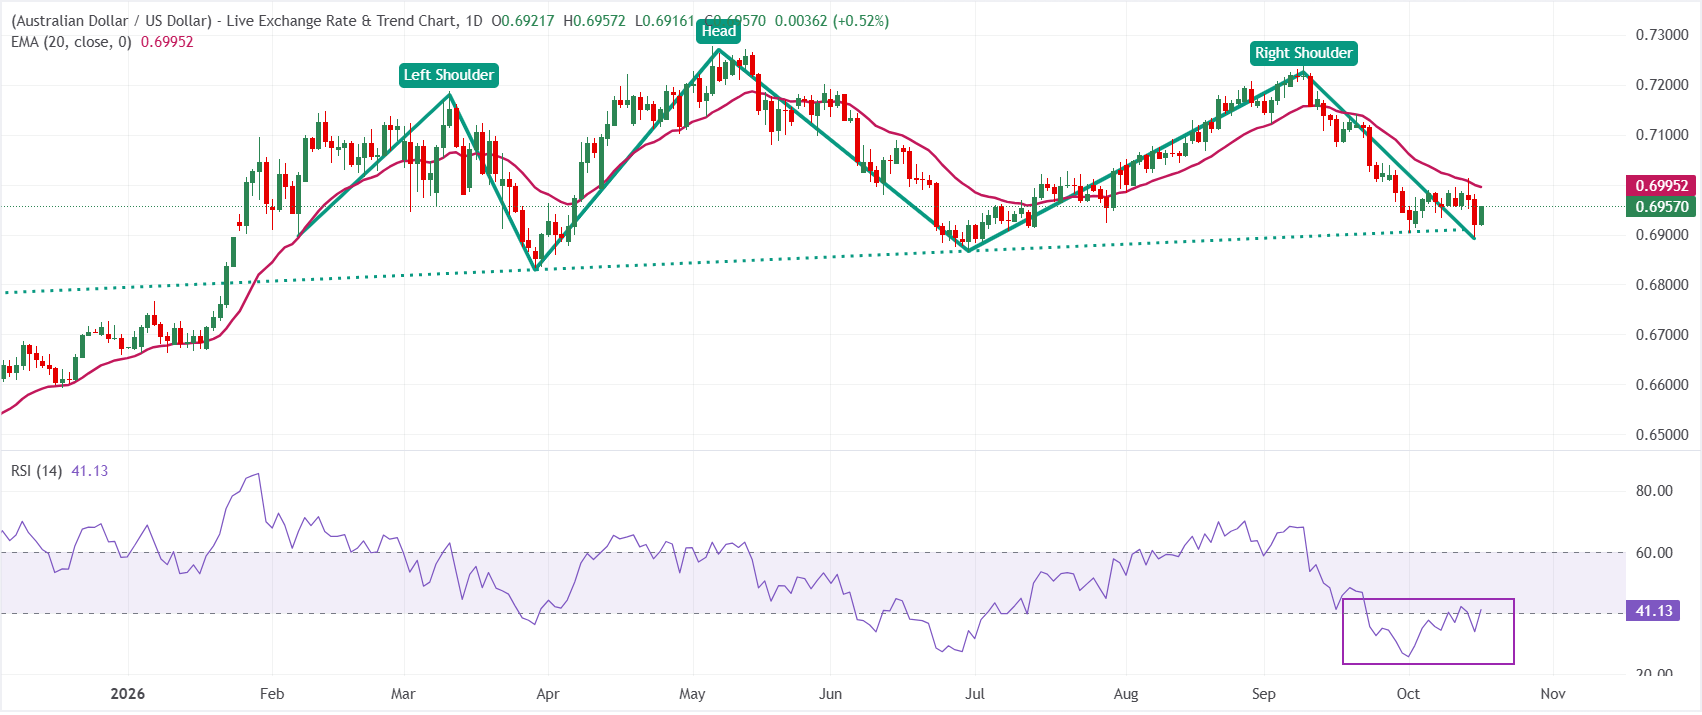
On the daily chart, AUD/USD trades at 0.6957, keeping a bearish near-term bias as spot remains under the 20-day Exponential Moving Average (EMA) at 0.6995. The Head and Shoulders (H&S) formation also supports the bearish bias. The pair has retreated from recent highs and is now capped by this short-term trend indicator, while the Relative Strength Index (RSI) at 41 stays below the midline, hinting at lingering downside pressure rather than an imminent recovery.
Strategists at UOB Group note that the recent break lower in AUD/USD marks a shift from the bank’s earlier range-trading view. They recall that, as of last Wednesday, with the spot around 0.6980, AUD “is likely to trade between 0.6935 and 0.7020.” However, the pair subsequently “rose to 0.7015 and then fell,” before extending losses yesterday and “broke below 0.6935 with a low of 0.6895.”
UOB highlights that “while downward momentum is increasing, it is not strong for now.” Even so, “the bias for AUD is on the downside,” with the bank cautioning that any further weakness “may not reach the June low of 0.6865.” On the topside, UOB adds that “a breach of 0.6980 would suggest that AUD is more likely to range-trade rather than declining further.”
(The technical analysis of this story was written with the help of an AI tool. Know more.)
추천 기사


