


Yen slips to a three-week low on US CPI, then recovers it all
- USD/JPY hits a three-week high just under 159.00, then slips back near 158.00.
- The Yen is the only major currency to gain against the Dollar on Wednesday.
- Japan's calendar is empty, and the Philadelphia Fed survey is due on Thursday.
All of USD/JPY's jump on the hotter-than-forecast US inflation figures is gone, and the pair is just above 158.00, below where it was before the release. It went from near 158.50 to just under 159.00, its highest since September 24, and then fell back as US bond yields reversed.
The Dollar is up against eight other major currencies on Wednesday and down against the Yen. USD/JPY rose with the 10-year Treasury yield on the release, made its high just after the yield's peak, and fell with it as the yield gave back its jump.
Vice Finance Minister for International Affairs Mimura, Japan's top currency official, told markets on September 28 to take the warning on the Yen from Tokyo and Washington at face value. That was four days after USD/JPY made the high just under 159.00 that it nearly matched on Wednesday. The Bank of Japan (BoJ) rate of 1.25% against 3.75%-4.00% at the Fed is the gap any such warning has to work against.
On the calendar
Japan has nothing of note left to publish before the weekend, and the BoJ's next decision comes on October 30, two days after the Fed's. Until then Japan's rate is set, which leaves US figures and anything Tokyo says about the Yen as the pair's remaining inputs.
The Philadelphia Fed's October factory survey is forecast to fall to 28.4 from 37.8 on Thursday, and Cleveland Fed President Hammack speaks the same day. US industrial production for September follows on Friday, forecast up 0.4% after no change in August, and all of it reaches USD/JPY through the Treasury yields it tracked on Wednesday.
On the charts
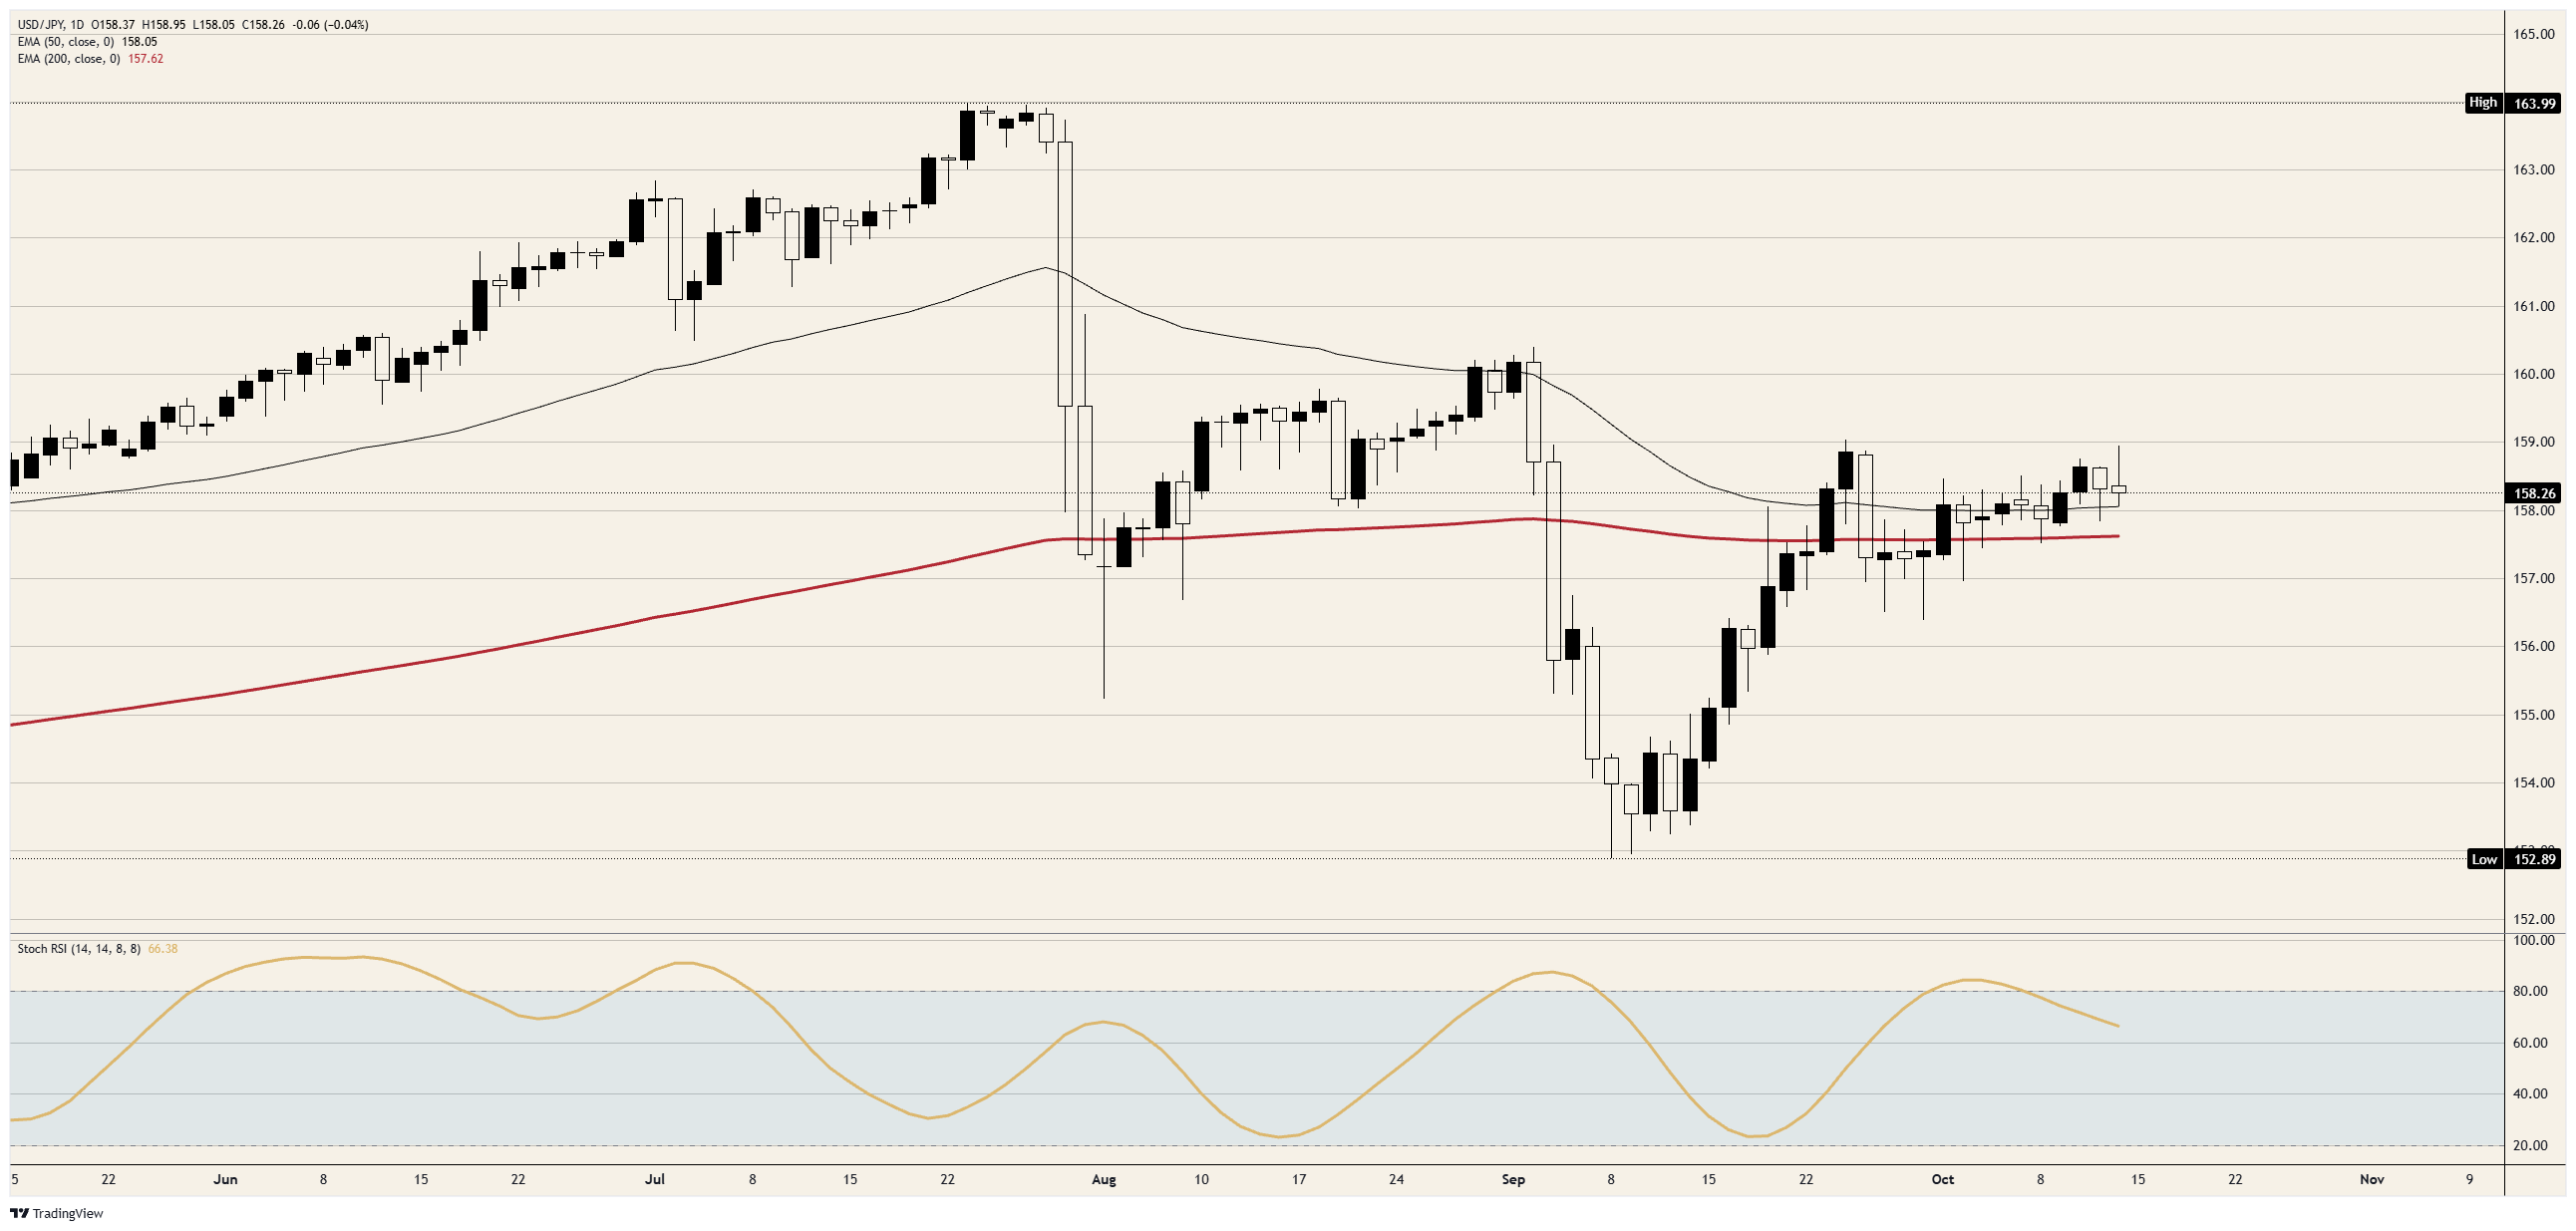
Wednesday's high is a little more than half of the way back up the drop from the July 23 high just under 164.00 to the September 8 low just under 153.00. The day's low came at the 50-day Exponential Moving Average (EMA), which is just above 158.00, with the 200-day EMA a little over 157.50, and daily momentum has been cooling from overbought since early October.
USD/JPY daily chart
Japanese Yen FAQs
The Japanese Yen (JPY) is one of the world’s most traded currencies. Its value is broadly determined by the performance of the Japanese economy, but more specifically by the Bank of Japan’s policy, the differential between Japanese and US bond yields, or risk sentiment among traders, among other factors.
One of the Bank of Japan’s mandates is currency control, so its moves are key for the Yen. The BoJ has directly intervened in currency markets sometimes, generally to lower the value of the Yen, although it refrains from doing it often due to political concerns of its main trading partners. The BoJ ultra-loose monetary policy between 2013 and 2024 caused the Yen to depreciate against its main currency peers due to an increasing policy divergence between the Bank of Japan and other main central banks. More recently, the gradually unwinding of this ultra-loose policy has given some support to the Yen.
Over the last decade, the BoJ’s stance of sticking to ultra-loose monetary policy has led to a widening policy divergence with other central banks, particularly with the US Federal Reserve. This supported a widening of the differential between the 10-year US and Japanese bonds, which favored the US Dollar against the Japanese Yen. The BoJ decision in 2024 to gradually abandon the ultra-loose policy, coupled with interest-rate cuts in other major central banks, is narrowing this differential.
The Japanese Yen is often seen as a safe-haven investment. This means that in times of market stress, investors are more likely to put their money in the Japanese currency due to its supposed reliability and stability. Turbulent times are likely to strengthen the Yen’s value against other currencies seen as more risky to invest in.
추천 기사


