


GBP/USD Price Forecast: Downside pressure could intensify below 1.3180
- GBP/USD drops to near 1.3248 as the US Dollar bounces back.
- Investors await FOMC minutes of the September policy meeting.
- The Fed is unlikely to hike interest rates in the policy meeting later this month.
The British Pound (GBP) trades 0.18% lower at around 1.3248 against the US Dollar (USD) during the early European trading session on Wednesday. The GBP/USD pair is under pressure as the US Dollar outperforms ahead of the release of Federal Open Market Committee (FOMC) minutes of the September policy meeting at 18:00 GMT.
As of writing, the US Dollar Index (DXY), which gauges the Greenback’s value against six major currencies, trades 0.22% higher at around 102.07.
Investors will pay close attention to the FOMC Minutes to get fresh cues regarding the Federal Reserve’s (Fed) monetary policy outlook. Currently, the CME FedWatch tool shows an almost 81% chance that the Fed will leave interest rates unchanged in the policy meeting later this month.
Lately, financial markets trimmed hawkish Fed bets due to soft Nonfarm Payrolls (NFP) data for September and signals from the Fed that there is no urgency for another interest rate hike.
Williams tempers post-hike path but keeps Fed firmly in hawkish territory
Fed’s Williams delivers a moderately hawkish message, with a FXS Speechtracker score of 6.4/10, slightly above the 6.2/10 historical average and signaling continuity rather than a tonal shift. The emphasis on “no need for urgency” after the September rate hike, coupled with data dependence and the conditional prospect of one further hike this year, points to a cautious but still tightening-biased stance, reinforced by the imperative to return inflation to 2% and concerns about AI-related price pressures. Longer-run projections of inflation only reaching target in 2028 and unemployment at 4% over 2027 underscore a view that policy must stay restrictive for an extended period despite strong and possibly strengthening US economic momentum.
The FXS Fed Sentiment Index fell by 1.43 points to 144.29, indicating a modest pullback in perceived hawkishness even as the index remains well above the neutral 100 mark. This configuration suggests that, relative to the established baseline, the Fed is still firmly in hawkish territory, but Williams’ stress on data dependence and lack of urgency slightly softens the tone captured by the FXS Speechtracker.
GBP/USD Technical Analysis
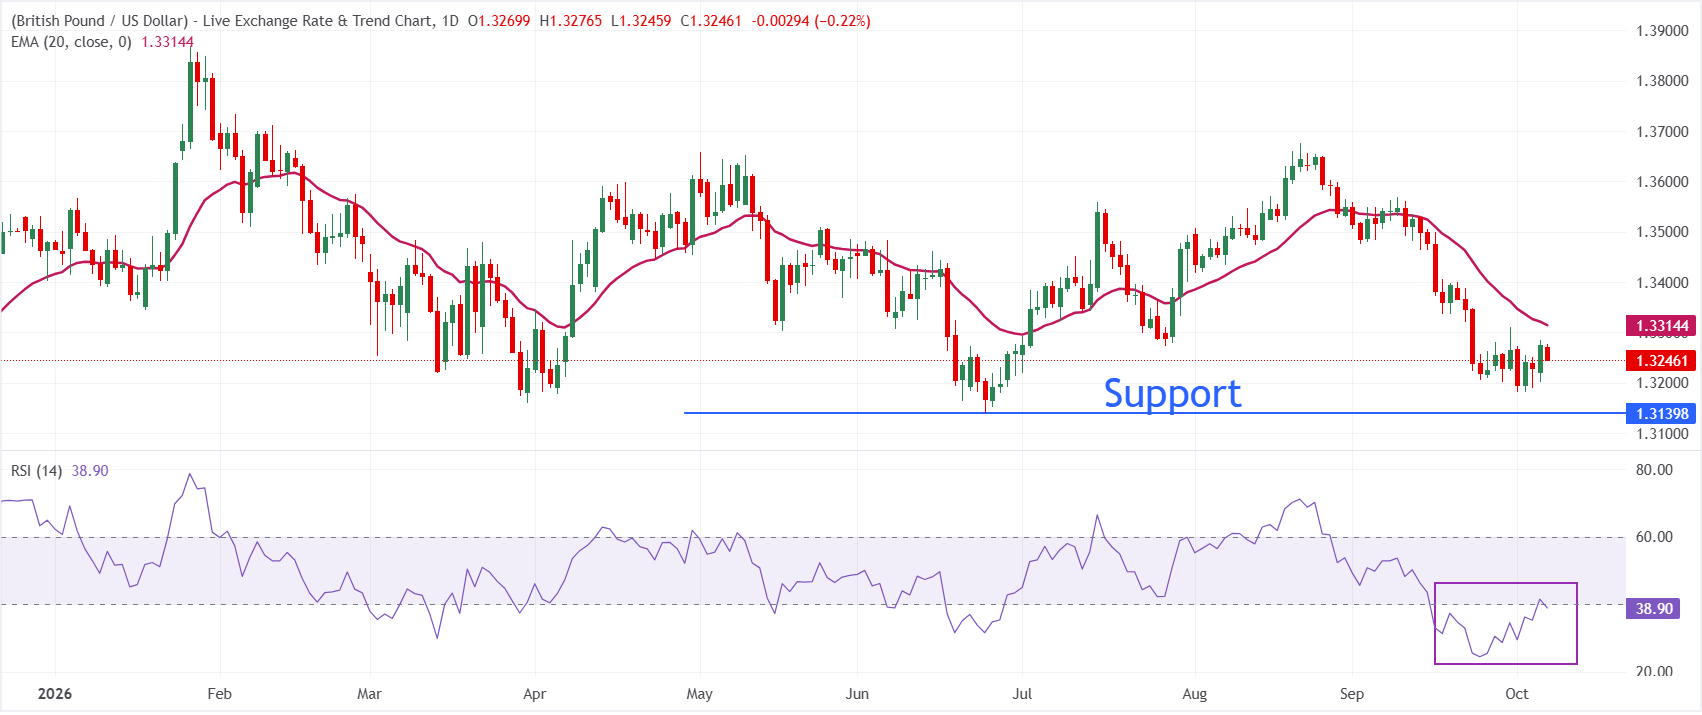
In the daily chart, GBP/USD trades at 1.3247, extending its retreat below the 20-period exponential moving average (EMA), which sits at 1.3315 and now caps the topside. Price action below this short-term trend marker hints at a bearish near-term bias, while the Relative Strength Index (RSI) around 39 remains in negative territory but avoids oversold conditions, suggesting selling pressure persists without being exhausted.
On the topside, immediate resistance is located at the 20-day EMA at 1.3315, and a daily close above this level would be needed to ease the current downside tone. Looking down, the October 1 low at 1.3181 is the immediate support level; a breakdown below the same would expose the pair to the yearly low near 1.3140.
(The technical analysis of this story was written with the help of an AI tool. Know more.)
Fed FAQs
Monetary policy in the US is shaped by the Federal Reserve (Fed). The Fed has two mandates: to achieve price stability and foster full employment. Its primary tool to achieve these goals is by adjusting interest rates. When prices are rising too quickly and inflation is above the Fed’s 2% target, it raises interest rates, increasing borrowing costs throughout the economy. This results in a stronger US Dollar (USD) as it makes the US a more attractive place for international investors to park their money. When inflation falls below 2% or the Unemployment Rate is too high, the Fed may lower interest rates to encourage borrowing, which weighs on the Greenback.
The Federal Reserve (Fed) holds eight policy meetings a year, where the Federal Open Market Committee (FOMC) assesses economic conditions and makes monetary policy decisions. The FOMC is attended by twelve Fed officials – the seven members of the Board of Governors, the president of the Federal Reserve Bank of New York, and four of the remaining eleven regional Reserve Bank presidents, who serve one-year terms on a rotating basis.
In extreme situations, the Federal Reserve may resort to a policy named Quantitative Easing (QE). QE is the process by which the Fed substantially increases the flow of credit in a stuck financial system. It is a non-standard policy measure used during crises or when inflation is extremely low. It was the Fed’s weapon of choice during the Great Financial Crisis in 2008. It involves the Fed printing more Dollars and using them to buy high grade bonds from financial institutions. QE usually weakens the US Dollar.
Quantitative tightening (QT) is the reverse process of QE, whereby the Federal Reserve stops buying bonds from financial institutions and does not reinvest the principal from the bonds it holds maturing, to purchase new bonds. It is usually positive for the value of the US Dollar.
추천 기사


