


Crypto Today: Bitcoin, Ethereum and XRP stabilize as bulls seek fresh rebound
- Bitcoin trades above $82,000, signaling stability and attempts to recover after a week-long correction.
- Ethereum ticks up as bulls eye the 50-day EMA as short-term support for recovery above $2,500.
- XRP rises and reclaims the $1.40 support level despite a firm MACD sell signal.
Cryptocurrency prices hold broadly stable on Friday, as Bitcoin (BTC) attempts to rise above the reclaimed $82,000 level. Ethereum (ETH) sits above the pivotal $2,500 level while Ripple (XRP) edges up after reclaiming the $1.40 level as support.
Crypto market sentiment softens
The sell-off in the crypto market this week was largely driven by macroeconomic headwinds, geopolitical tensions in the Middle East amid elevated Oil and Energy prices, and overleveraged long positions. Bitcoin declined from highs near $87,000, testing support at $80,000 on Thursday.
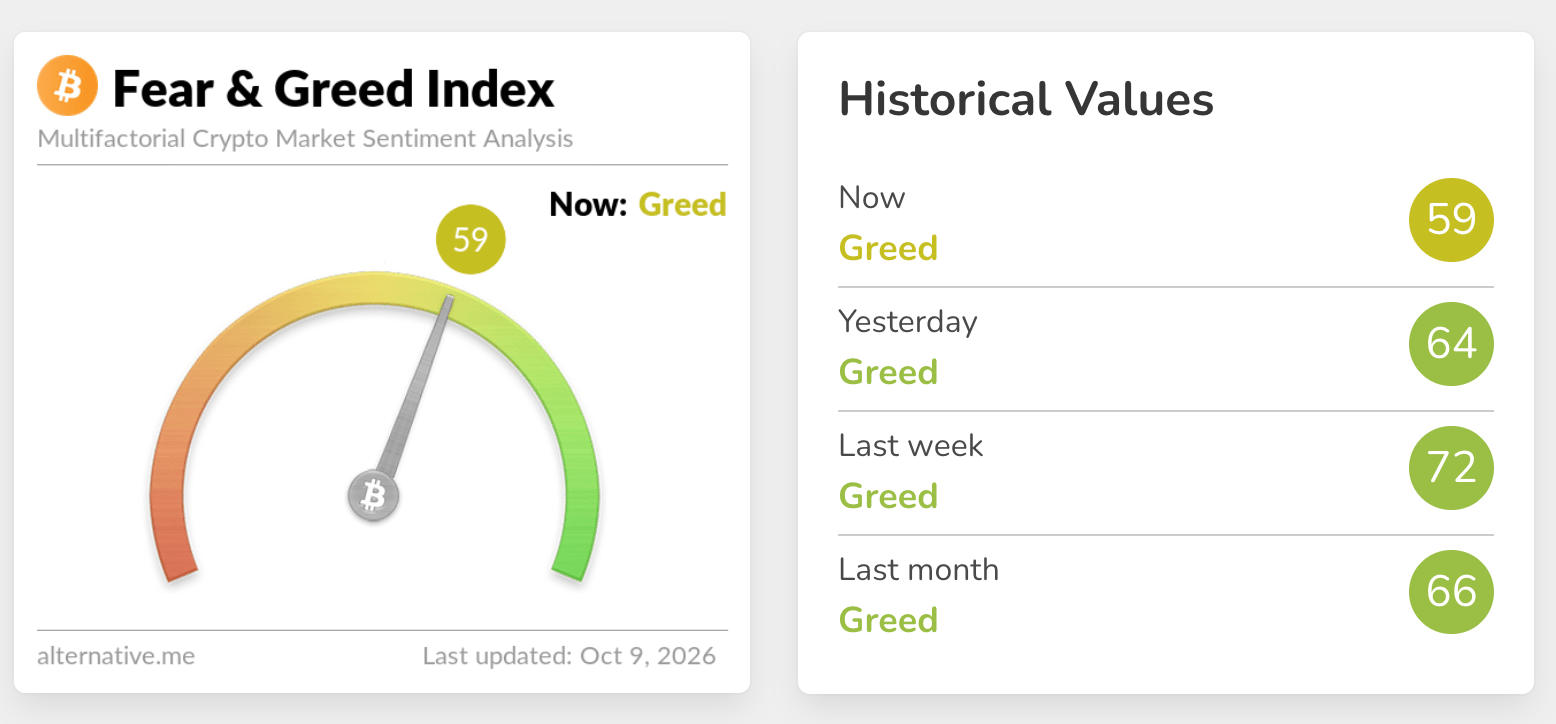
The correction appeared to align with softening demand for crypto assets, as reflected in the Fear & Greed Index at 59 in the Greed territory on Friday, down from 64 the day before. Broadly, the index has retreated from levels at 72 last week and 66 last month.
The Federal Open Market Committee (FOMC) Minutes showed that most officials still expect another rate hike by year-end despite odds of raising rates in October falling below 20%.
Crypto Finance said in an emailed analysis report that “BTC's push toward $87,000 failed and ETH slipped below $2,500. Spot BTC Exchange-Traded Funds (ETFs) shed roughly $700 million from Monday to Thursday, with Wednesday's $487 million the heaviest day of the month, while ETH ETFs lost $486 million, extending a streak that began on 29 September.”
Despite the ongoing recovery, headwinds from capital outflows, macroeconomic uncertainty and geopolitical tensions will likely continue to weigh on market sentiment. Recoveries could be capped, allowing consolidation, especially as demand at $80,000 holds.
Technical analysis: Bitcoin reclaims $82,000 support
Bitcoin has risen above $82,000 as bulls return following this week's sustained sell-off. The largest crypto by market capitalization shows signs of a potential recovery despite facing key psychological resistance levels, as observed on the daily chart.
Moreover, BTC holds well above the 50-day, 100-day and 200-day Exponential Moving Averages (EMAs), which collectively suggest a constructive bullish backdrop. Price also remains above the SuperTrend line at $79,664, reinforcing underlying demand, while the Moving Average Convergence Divergence (MACD) histogram stays negative and the Relative Strength Index (RSI) hovers around the neutral 50 mark, hinting that upside momentum is currently modest rather than impulsive.
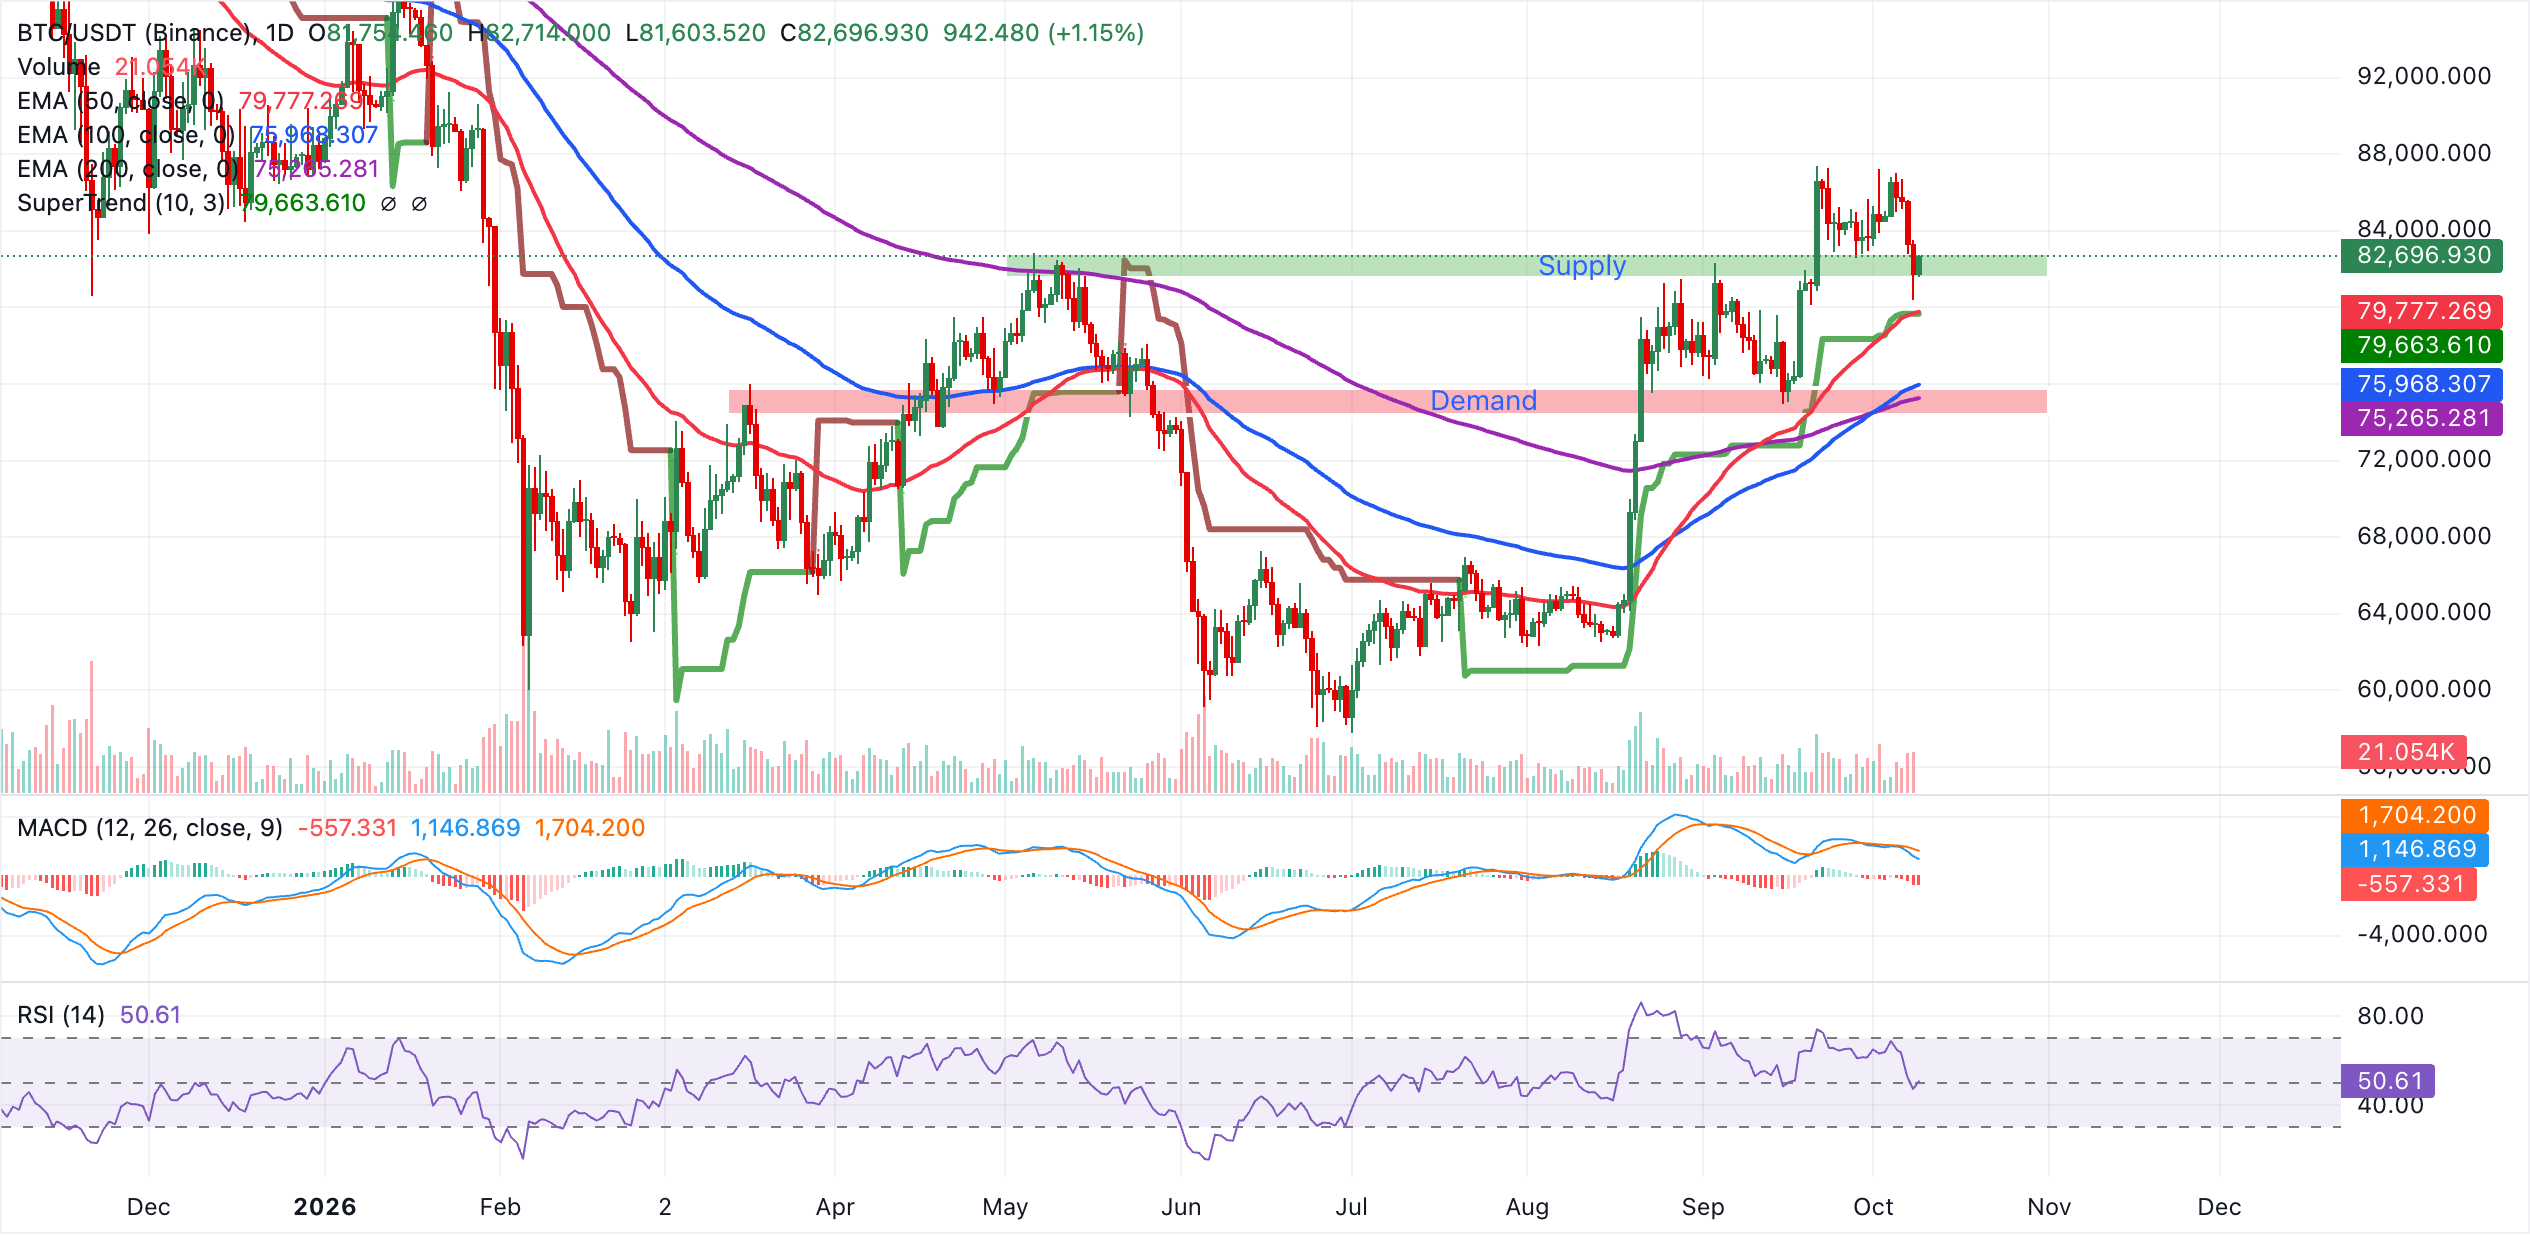
Initial support is seen in the $79,700-$79,800 area, where the SuperTrend and the 50-day EMA form a nearby demand cluster just below spot, followed by the 100-day EMA at $75,968 and the 200-day EMA at $75,265 as deeper trend supports. With no immediate technical resistance levels above the market on the daily chart, the pair would likely need a clear uptick in momentum to extend the advance. Still, a daily close back below the $82,000 zone would start to erode the current bullish bias and expose the next EMA supports lower.
Altcoins technical analysis: Ethereum and XRP defend key demand levels
Ethereum bulls are attempting an upward correction from the sharp sell-off from weekly highs of $2,735. The smart contract token holds above $2,500, seeking steady support to help build momentum. The pair maintains a constructive near-term bias as price sits above the 50-day, 100-day and 200-day EMA curves at $2,503, $2,340 and $2,299, respectively.
This alignment of short- and longer-term EMAs suggests underlying demand, although momentum is mixed, with the MACD below zero and deepening in negative territory while the RSI cools toward the 40 area, hinting at a consolidative rather than impulsive phase.
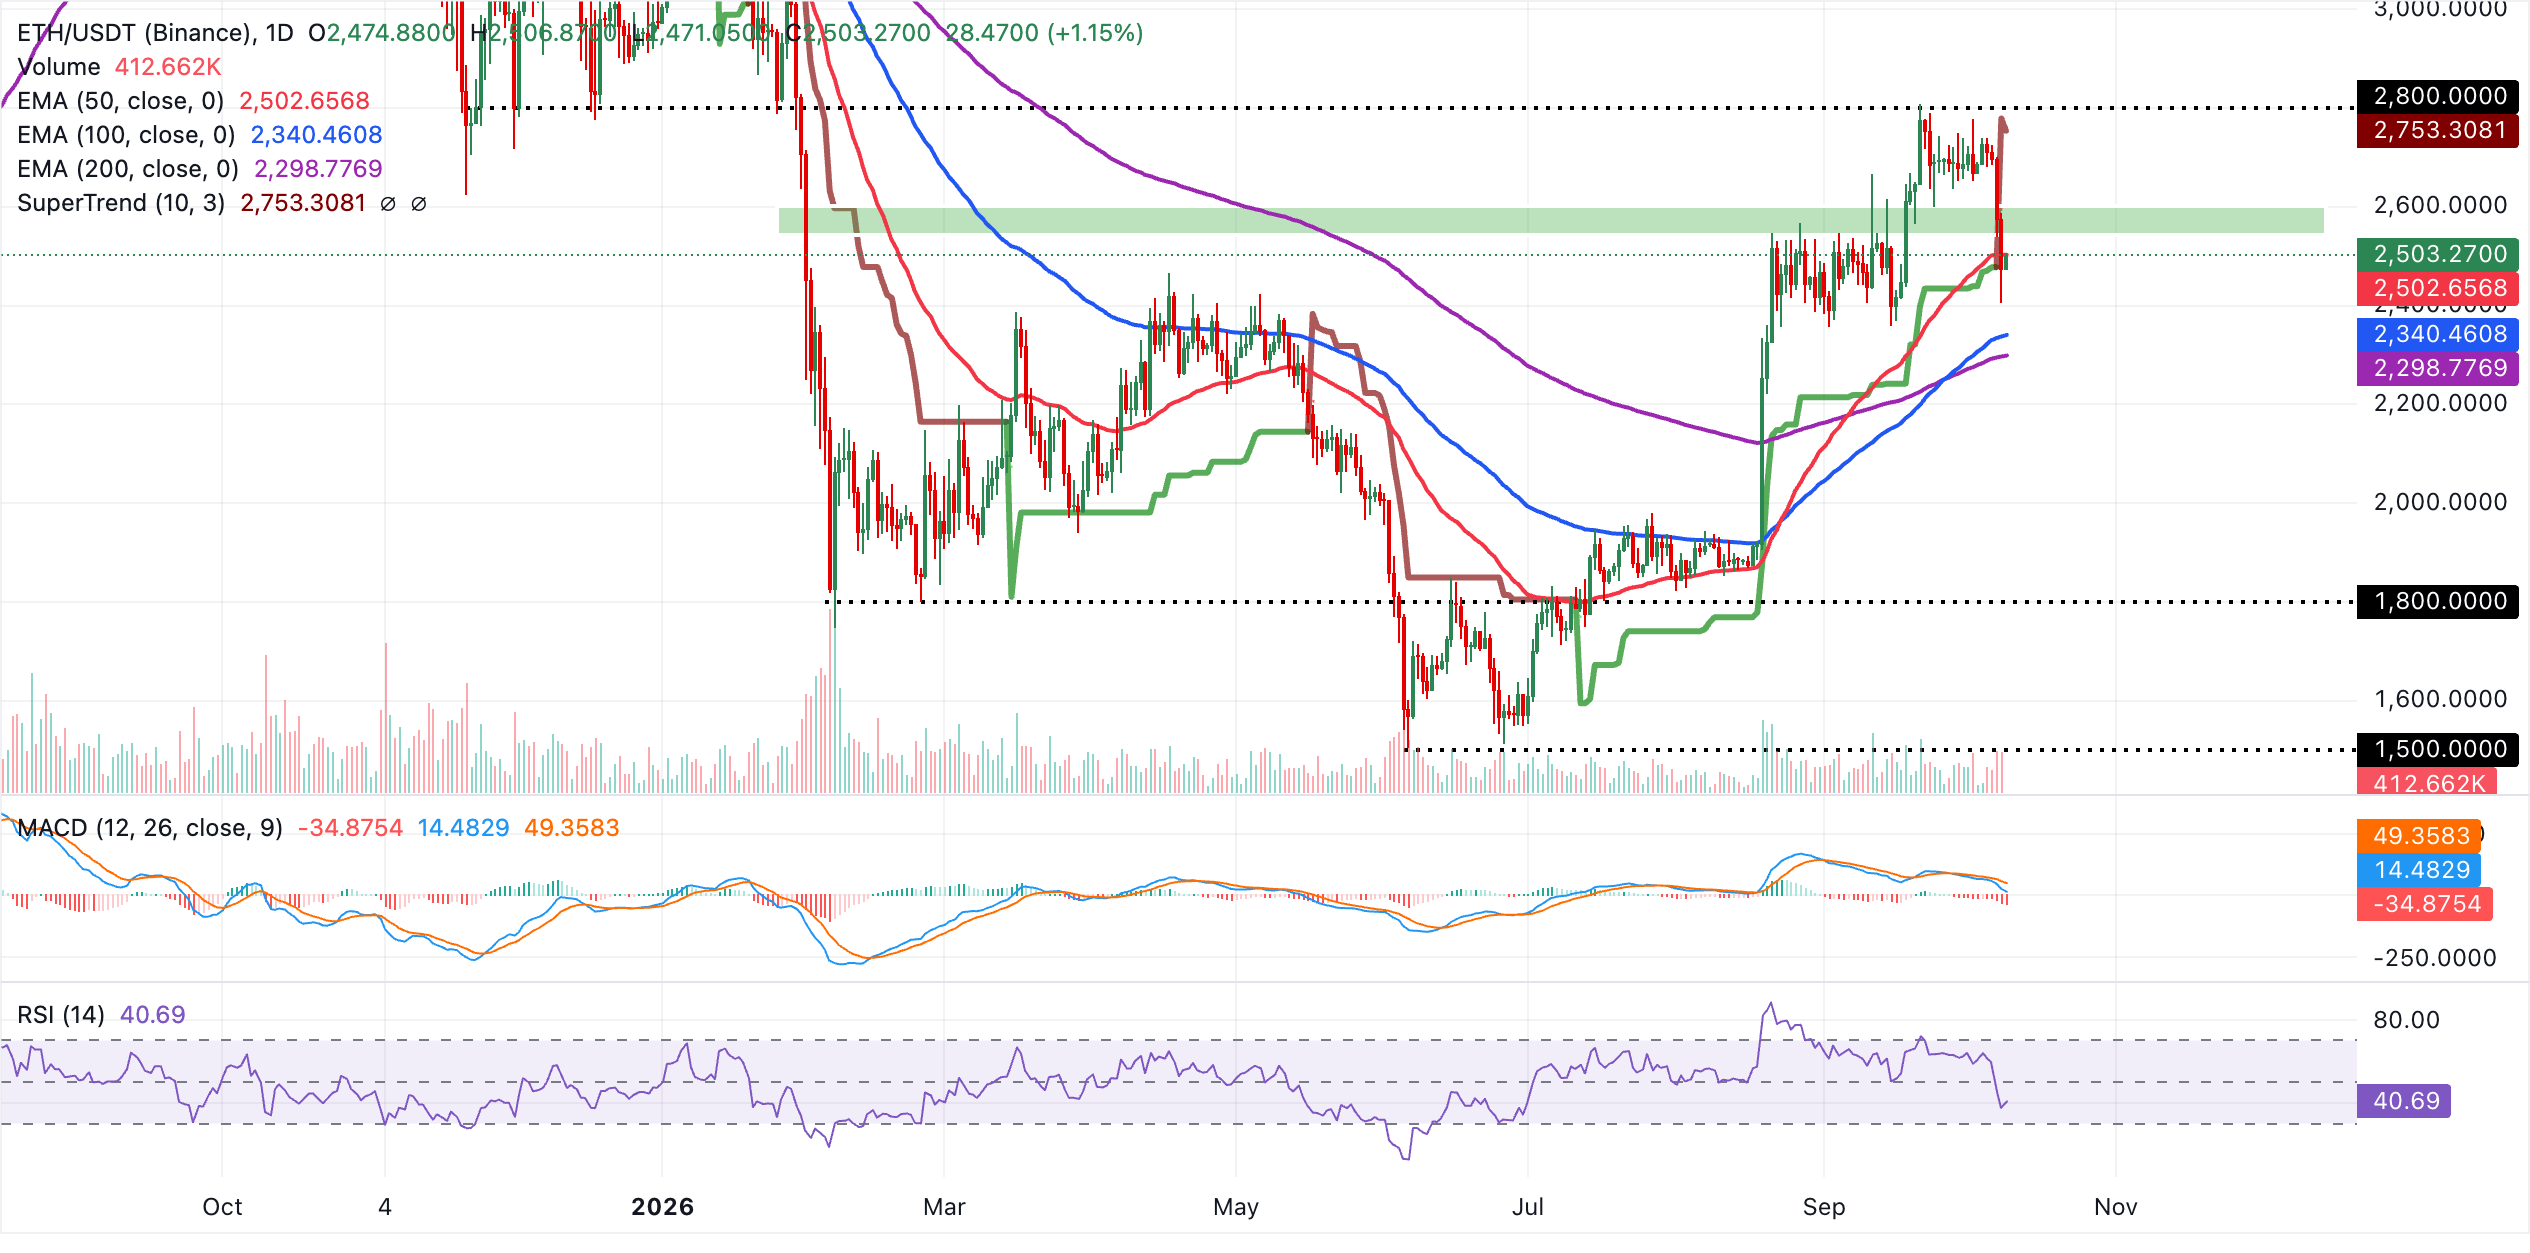
Immediate support is the 50-day EMA at $2,503, with additional demand at the 100-day EMA near $2,340 and the 200-day EMA around $2,299 if selling extends. On the topside, the SuperTrend line at $2,753 is the next notable resistance, and a clear break above this dynamic barrier would likely reopen the path toward recent highs, while failure to reclaim it keeps ETH in a range anchored by the clustered moving-average support below.
XRP, meanwhile, sits above a solid technical structure, raising recovery odds. The token hovers above $1.40, up from weekly lows near $1.30. Despite the headwinds, XRP is holding a constructive near-term tone as it remains above the key moving averages.
Price is trading above the 50-day EMA near $1.40, the 200-day EMA at $1.38, and the 100-day EMA at $1.34, while the SuperTrend indicator at $1.30 reinforces underlying support. However, momentum is soft, with the RSI hovering near 44 and the MACD below zero, suggesting that the bullish bias is supported by structure rather than by strong upside momentum.
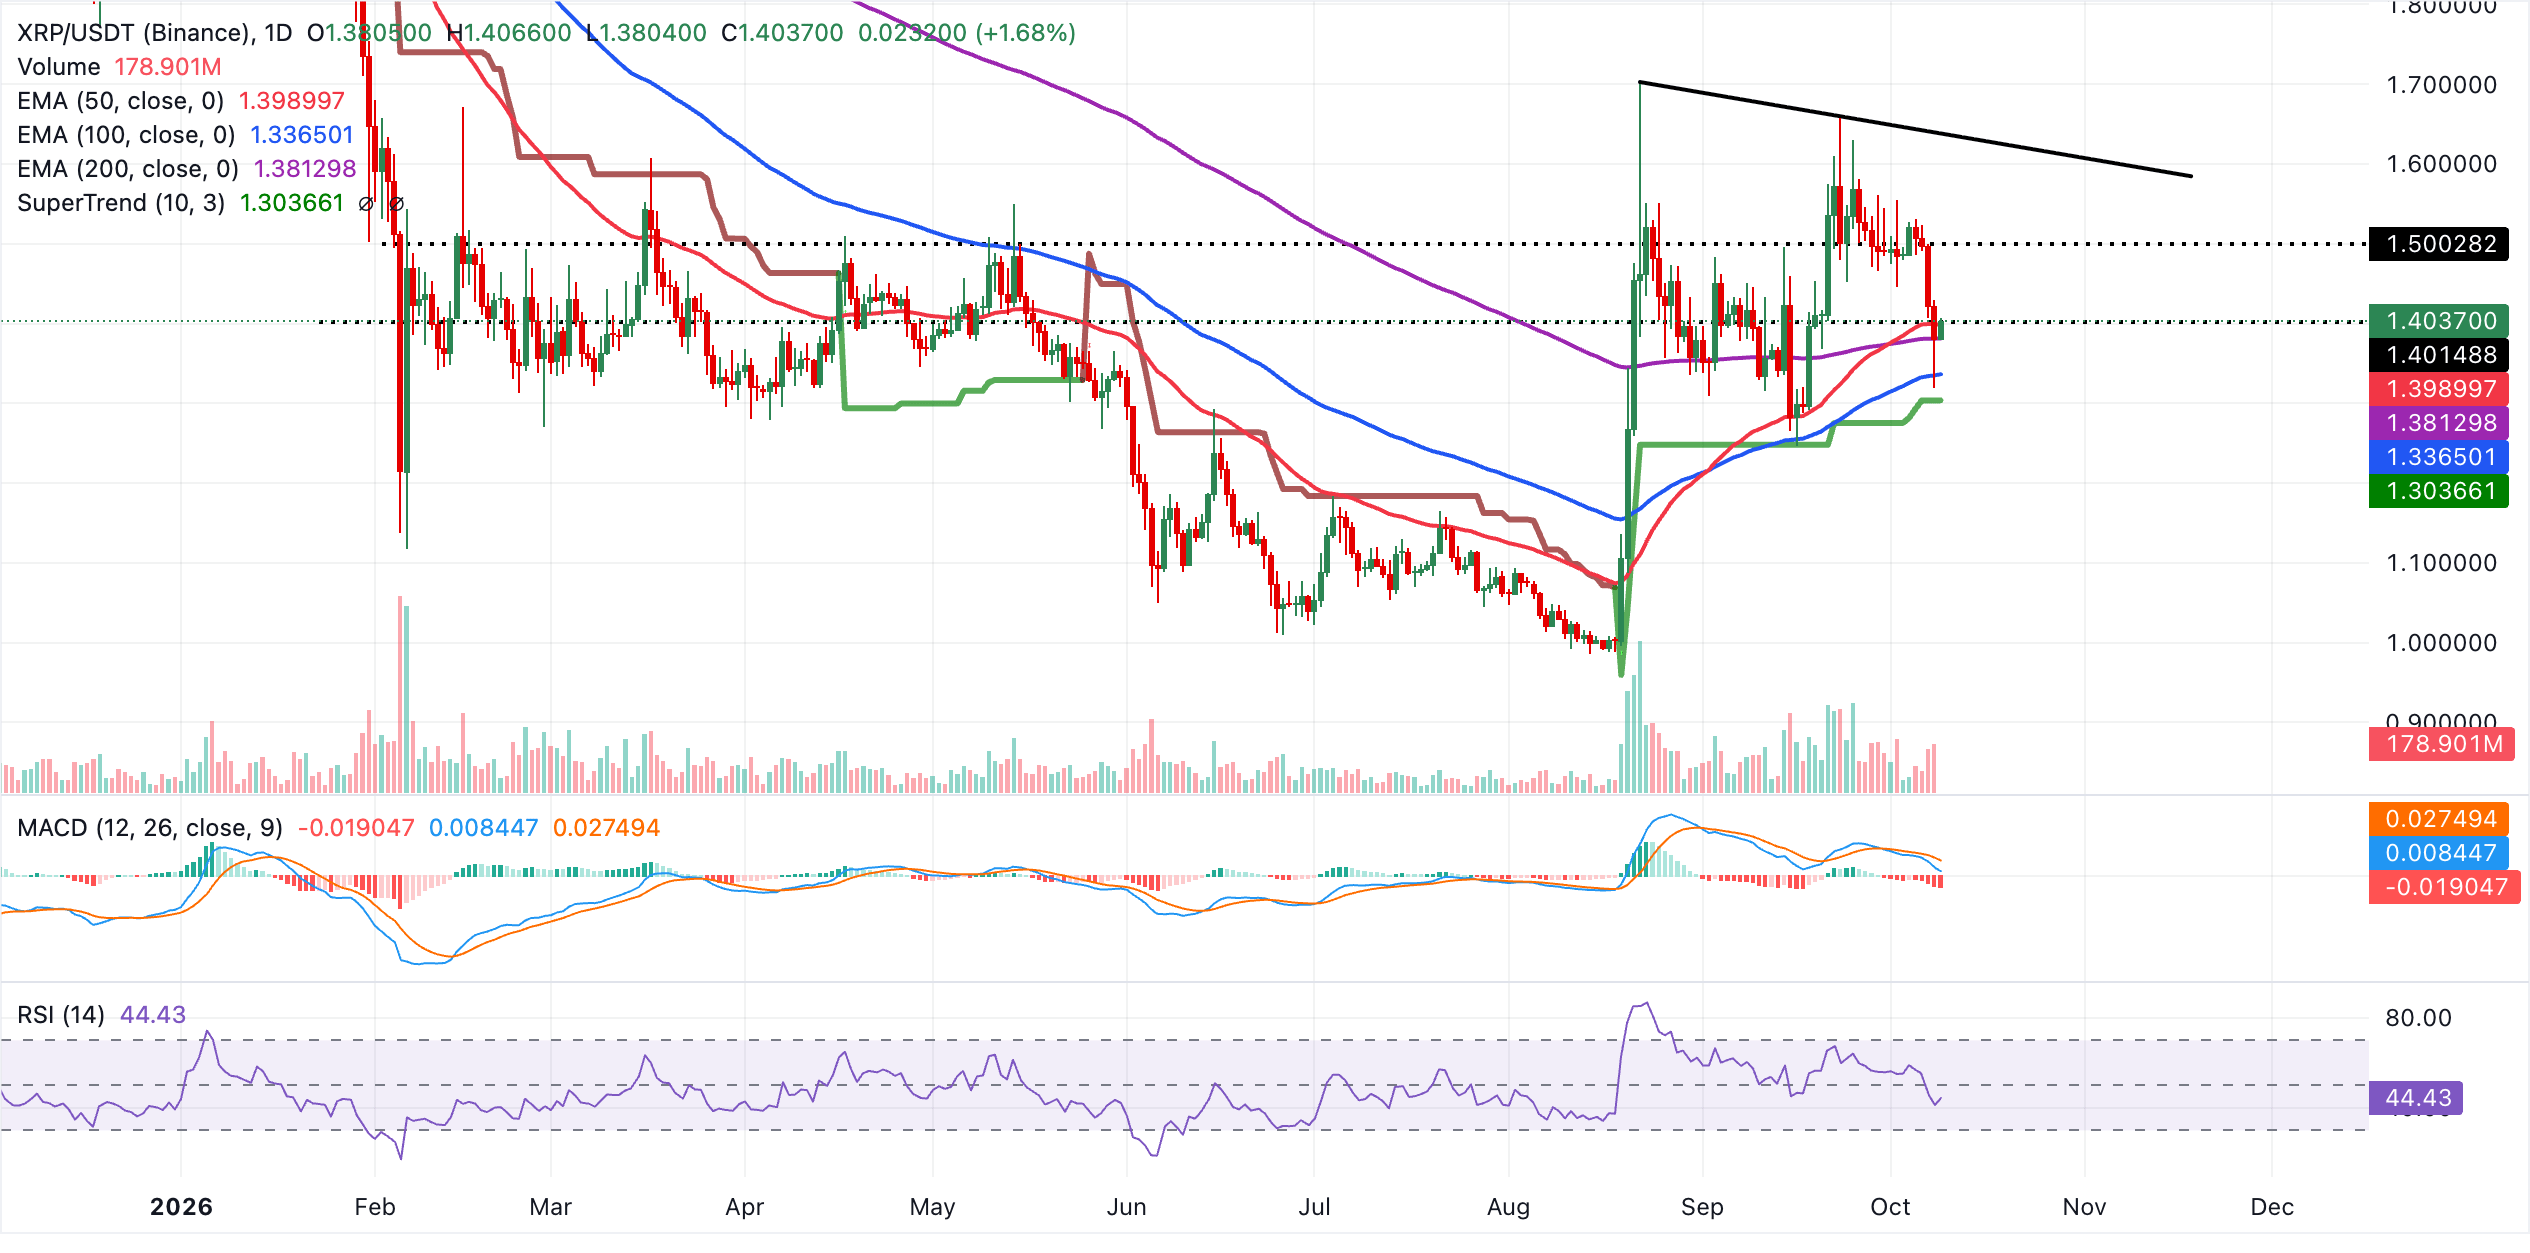
The first support level is the 50-day EMA near $1.40, followed by the 200-day EMA at $1.38. Deeper pullbacks would look toward the 100-day EMA at $1.34 and the SuperTrend line at $1.30 as broader trend support. On the topside, the next notable resistance looms at the downward resistance trendline break price around $1.64, and a daily close above this barrier would be needed to open a more extended bullish phase.
(The technical analysis of this story was written with the help of an AI tool. Know more.)
Bitcoin, altcoins, stablecoins FAQs
Bitcoin is the largest cryptocurrency by market capitalization, a virtual currency designed to serve as money. This form of payment cannot be controlled by any one person, group, or entity, which eliminates the need for third-party participation during financial transactions.
Altcoins are any cryptocurrency apart from Bitcoin, but some also regard Ethereum as a non-altcoin because it is from these two cryptocurrencies that forking happens. If this is true, then Litecoin is the first altcoin, forked from the Bitcoin protocol and, therefore, an “improved” version of it.
Stablecoins are cryptocurrencies designed to have a stable price, with their value backed by a reserve of the asset it represents. To achieve this, the value of any one stablecoin is pegged to a commodity or financial instrument, such as the US Dollar (USD), with its supply regulated by an algorithm or demand. The main goal of stablecoins is to provide an on/off-ramp for investors willing to trade and invest in cryptocurrencies. Stablecoins also allow investors to store value since cryptocurrencies, in general, are subject to volatility.
Bitcoin dominance is the ratio of Bitcoin's market capitalization to the total market capitalization of all cryptocurrencies combined. It provides a clear picture of Bitcoin’s interest among investors. A high BTC dominance typically happens before and during a bull run, in which investors resort to investing in relatively stable and high market capitalization cryptocurrency like Bitcoin. A drop in BTC dominance usually means that investors are moving their capital and/or profits to altcoins in a quest for higher returns, which usually triggers an explosion of altcoin rallies.
추천 기사


