


US CPI data set to show softer inflation in July as markets reassess Fed rate hike bets
- The US Consumer Price Index is expected to rise by 3.4% YoY in July, down slightly from the 3.5% advance seen in June.
- Annual core CPI inflation is expected to edge lower to 2.5% from 2.6% previously.
- EUR/USD technical outlook highlights bulls’ hesitancy in the near term.
The US Bureau of Labor Statistics (BLS) will publish the July Consumer Price Index (CPI) data on Wednesday. The report is expected to show a small decline in consumer inflation and core inflation.
The monthly CPI is forecast to rise by 0.1%, following the 0.4% decrease recorded in June, while the annual reading is seen retreating to 3.4% from 3.5% reported in the previous month. Core CPI figures, which exclude volatile food and energy prices, are expected to post an increase of 0.2% and 2.5%, on a monthly and yearly basis, respectively.
Following a nearly 16% drop in May, Crude Oil prices declined roughly 20% in June and came back to pre-war levels, as investors cheered news of the US and Iran reaching a ceasefire on June 17 to start negotiations to bring an end to the conflict. As a result, CPI inflation softened at a much faster pace than expected in June.
US inflation seen rebounding as services and core goods firm
According to TD Securities, July inflation data are likely to show a modest increase after June’s temporary softness. The bank expects that “July core CPI likely rebounded after June’s one-off weakness, rising 0.20% m/m as services inflation reaccelerated, led by rents/OER, airfares, medical, and recreation.” TD also highlights that “core goods likely posted their first increase in three months,” while “headline CPI likely rose 0.15% m/m, with lower gasoline offset by faster grocery prices.” Overall, TD cautions that “upside risks remain” around the upcoming release.
Economic Indicator
Consumer Price Index ex Food & Energy (MoM)
Inflationary or deflationary tendencies are measured by periodically summing the prices of a basket of representative goods and services and presenting the data as the Consumer Price Index (CPI). CPI data is compiled on a monthly basis and released by the US Department of Labor Statistics. The MoM print compares the prices of goods in the reference month to the previous month.The CPI Ex Food & Energy excludes the so-called more volatile food and energy components to give a more accurate measurement of price pressures. Generally speaking, a high reading is seen as bullish for the US Dollar (USD), while a low reading is seen as bearish.
Read more.Next release: Wed Aug 12, 2026 12:30
Frequency: Monthly
Consensus: 0.2%
Previous: 0%
Source: US Bureau of Labor Statistics
The US Federal Reserve has a dual mandate of maintaining price stability and maximum employment. According to such mandate, inflation should be at around 2% YoY and has become the weakest pillar of the central bank’s directive ever since the world suffered a pandemic, which extends to these days. Price pressures keep rising amid supply-chain issues and bottlenecks, with the Consumer Price Index (CPI) hanging at multi-decade highs. The Fed has already taken measures to tame inflation and is expected to maintain an aggressive stance in the foreseeable future.
What to expect in the next CPI data report?
As the US and Iran failed to find an agreement to reopen the Strait of Hormuz and started exchanging military attacks, crude Oil prices recovered in July, with the barrel of West Texas Intermediate (WTI) rising nearly 22% in the month. Nevertheless, news of Iran and Oman working on a deal to manage the waterway helped Oil prices ease in the first week of August. Combined with the disappointing July labor market data from the US, which showed that Nonfarm Payrolls (NFP) unexpectedly declined by 23K, investors scaled back bets for a Federal Reserve (Fed) rate hike in September.
According to the CME Group FedWatch Tool, markets are currently pricing in about a 52% chance of a 25 basis points (bps) increase in interest rates at the next policy meeting.
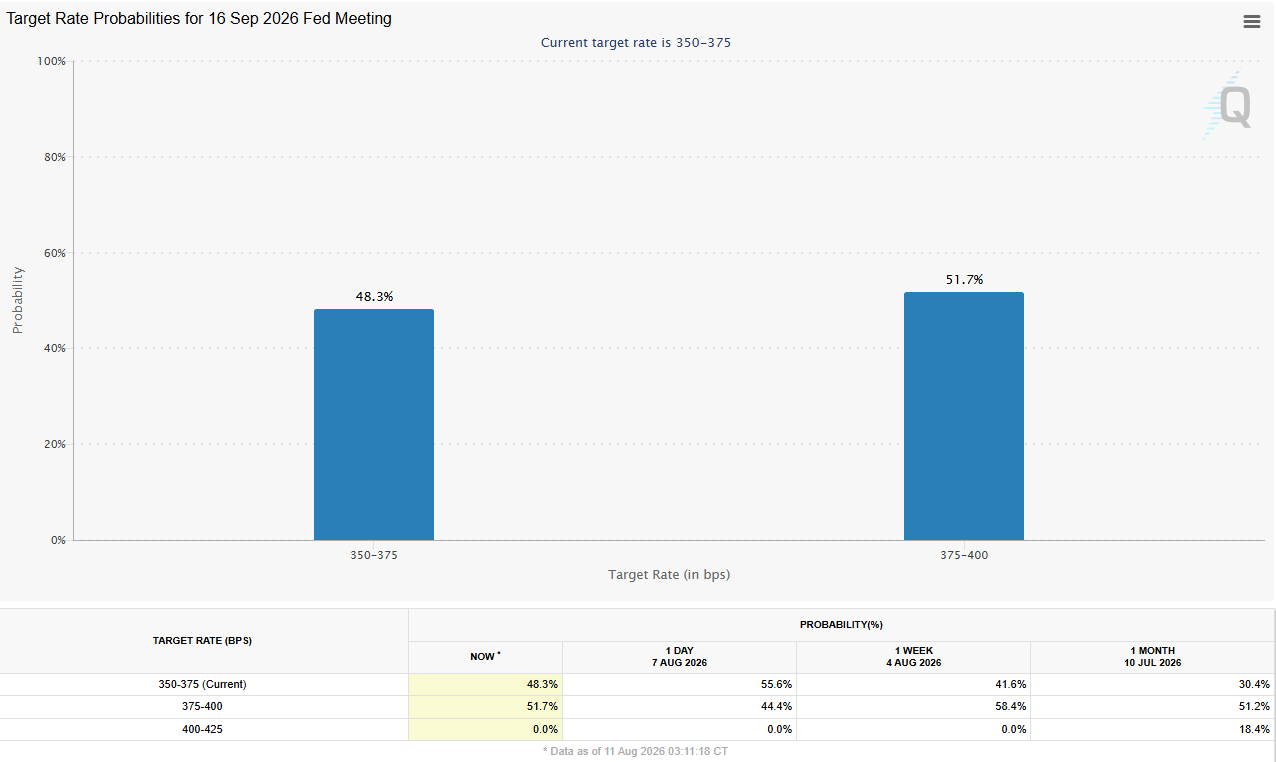
Still, markets remain sceptical about a policy hold after Oil prices started to push higher this week, with Iran saying that an agreement with Oman would not be enough to resume activity in the Strait of Hormuz unless the US agreed to a list of conditions.
Analysts at OCBC argue that the bar for a meaningful shift in Fed expectations remains elevated, noting that “core CPI would need to print at 0.3% MoM or higher in July, above the 0.2% consensus forecast, to materially lift expectations of a September rate hike.” In their view, a “rangebound USD, combined with a constructive risk backdrop, should continue to support carry trades despite ongoing volatility in oil markets.” They add that recent “oil prices eased on hopes that the Strait of Hormuz could reopen, but Iran's firm conditions for Washington suggest any near-term boost to energy supply is likely to be limited,” keeping the outlook for energy markets finely balanced.
How could the US Consumer Price Index report affect EUR/USD?
Markets will pay close attention to the monthly core CPI print to see how volatile energy costs are spreading into the wider economy. A monthly core CPI increase of 0.3% or higher, in addition to the elevated uncertainty surrounding the Oil price outlook, could revive expectations for a Fed policy tightening step in September and boost the US Dollar (USD) with the immediate reaction. In this scenario, EUR/USD could come under renewed bearish pressure.
Conversely, a core CPI reading below the market expectation of 0.2% could cause the USD to weaken and pave the way for a leg higher in EUR/USD.
Since CPI is a lagging indicator, the market reaction could remain short-lived. Instead, investors are likely to continue to assess changes in Oil prices. Even if the monthly core CPI surprises to the upside, a decline in Oil prices could allow market participants to lean toward a Fed policy hold and hurt the USD. On the other hand, investors could ignore soft inflation data for July in case tensions escalate further in the Middle East, pushing energy costs higher.
Eren Sengezer, European Session Lead Analyst, shares a brief technical outlook for EUR/USD:
“EUR/USD climbed slightly above a descending trend line drawn from late-January but lost its traction after testing the 100-day Simple Moving Average (SMA), currently located near 1.1570. Additionally, the Relative Strength Index (RSI) indicator on the daily chart retreated below 60, reflecting a loss of bullish momentum.”
“On the upside, 1.1570 (100-day SMA) aligns as an interim resistance level before 1.1630 (200-day SMA). A daily close above this latter resistance could be seen as a significant bullish sign and open the door for an extended rally toward 1.1800 (static level). Looking south, the first support level could be spotted at 1.1470 (20-day SMA, 50-day SMA) ahead of 1.1350-1.1330 (static level, lower boundary of the Bollinger Bands).”
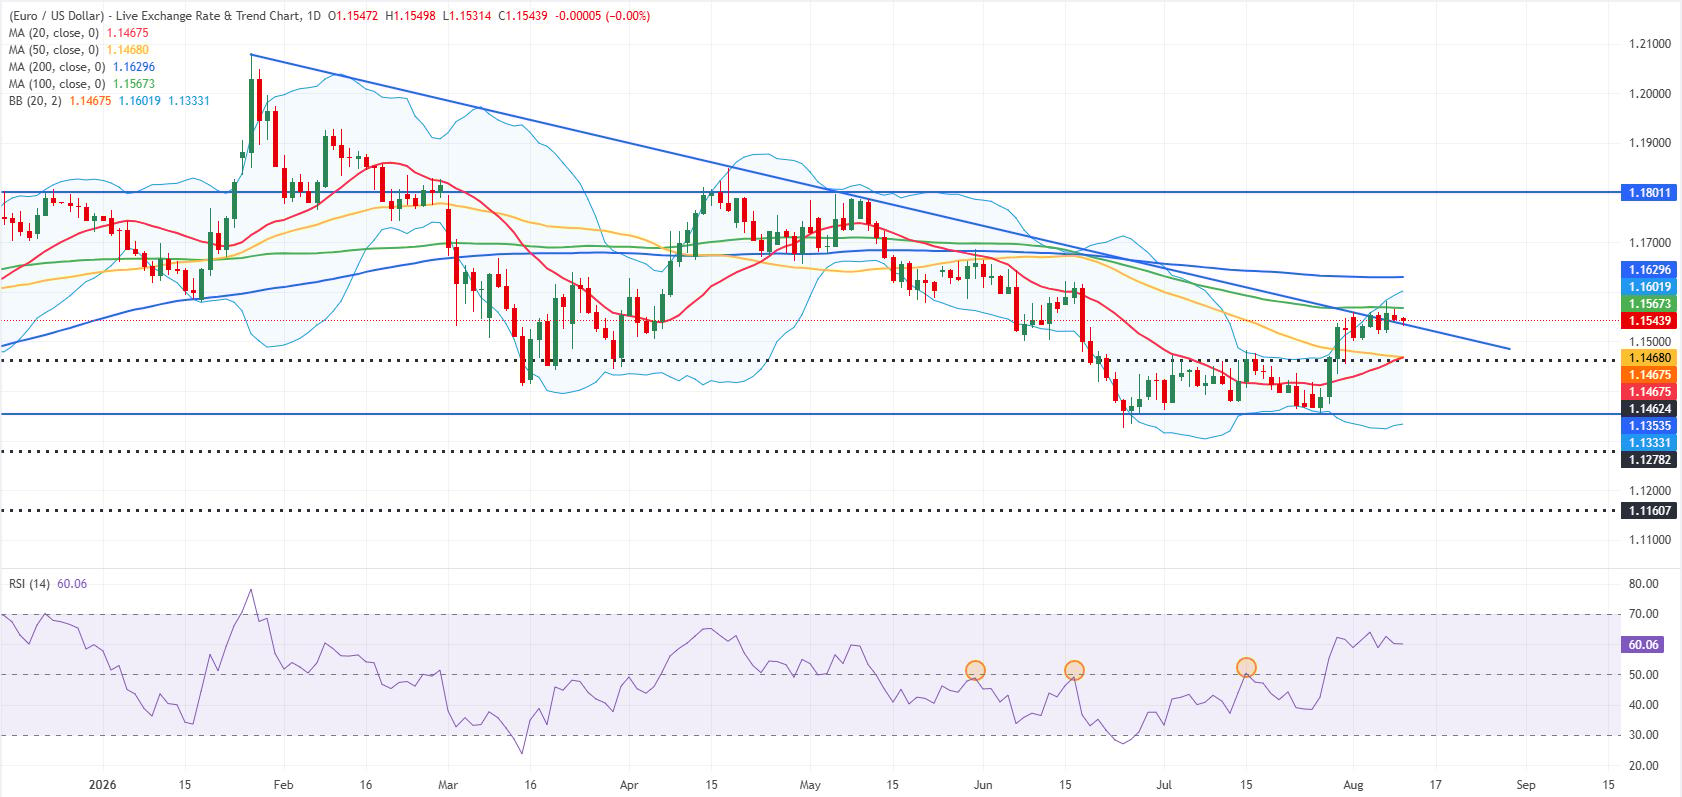
Analysts at UOB Group note that “there has been no significant increase in upward momentum, and the hurdle for further gains has risen, with EUR needing to close above 1.1580 before a move to 1.1600 and beyond can be expected.” In addition, the bank now places the “‘strong support’ level” higher, at “1.1515 instead of 1.1495,” underscoring a tighter trading band as the Euro consolidates.
Inflation FAQs
Inflation measures the rise in the price of a representative basket of goods and services. Headline inflation is usually expressed as a percentage change on a month-on-month (MoM) and year-on-year (YoY) basis. Core inflation excludes more volatile elements such as food and fuel which can fluctuate because of geopolitical and seasonal factors. Core inflation is the figure economists focus on and is the level targeted by central banks, which are mandated to keep inflation at a manageable level, usually around 2%.
The Consumer Price Index (CPI) measures the change in prices of a basket of goods and services over a period of time. It is usually expressed as a percentage change on a month-on-month (MoM) and year-on-year (YoY) basis. Core CPI is the figure targeted by central banks as it excludes volatile food and fuel inputs. When Core CPI rises above 2% it usually results in higher interest rates and vice versa when it falls below 2%. Since higher interest rates are positive for a currency, higher inflation usually results in a stronger currency. The opposite is true when inflation falls.
Although it may seem counter-intuitive, high inflation in a country pushes up the value of its currency and vice versa for lower inflation. This is because the central bank will normally raise interest rates to combat the higher inflation, which attract more global capital inflows from investors looking for a lucrative place to park their money.
Formerly, Gold was the asset investors turned to in times of high inflation because it preserved its value, and whilst investors will often still buy Gold for its safe-haven properties in times of extreme market turmoil, this is not the case most of the time. This is because when inflation is high, central banks will put up interest rates to combat it. Higher interest rates are negative for Gold because they increase the opportunity-cost of holding Gold vis-a-vis an interest-bearing asset or placing the money in a cash deposit account. On the flipside, lower inflation tends to be positive for Gold as it brings interest rates down, making the bright metal a more viable investment alternative.
추천 기사


