


Japanese Yen trades broadly flat against US Dollar, NFP data eyed
- The Japanese Yen consolidates at around 158.42 against the US Dollar ahead of the US NFP data for July.
- The US NFP data is expected to significantly influence Fed interest rate expectations.
- An absence of US-Japan follow-up intervention weighs on the Japanese Yen.
The Japanese Yen (JPY) trades almost flat against the US Dollar (USD) at around 158.42 during the European trading session on Friday. The USD/JPY pair consolidates as investors await the United States (US) Nonfarm Payrolls (NFP) data for July, which will be published at 12:30 GMT.
Deutsche Bank looks for modest payrolls gain with US unemployment steady at 4.2%
Economists at Deutsche Bank expect only a modest improvement in today’s US labour market report, projecting “a slight uptick in headline (+65k forecast vs. +57k previously) and private (+65k vs. +49k) payrolls.” At the same time, they see little change in joblessness, anticipating that “the unemployment rate [will] remain unchanged at 4.2% on a rounded basis versus 4.19% last month, which was its lowest reading in a year, even if it was accompanied by a 0.3pp fall in the labour force participation.”
Ahead of the US NFP data, the US Dollar Index (DXY), which gauges the Greenback’s value against six major currencies, trades flat at around 100.00.
The impact of the US NFP data will be significant for the Federal Reserve’s (Fed) monetary policy outlook in the absence of so-called “forward guidance” from the central bank.
Meanwhile, the Japanese Yen (JPY) has broadly underperformed this week due to the absence of follow-up US-Japan joint intervention.
Japanese Yen Price This week
The table below shows the percentage change of Japanese Yen (JPY) against listed major currencies this week. Japanese Yen was the weakest against the US Dollar.
| USD | EUR | GBP | JPY | CAD | AUD | NZD | CHF | |
|---|---|---|---|---|---|---|---|---|
| USD | 0.23% | 0.34% | 0.81% | 0.08% | 0.06% | 0.53% | 0.59% | |
| EUR | -0.23% | 0.12% | 0.58% | -0.14% | -0.07% | 0.32% | 0.39% | |
| GBP | -0.34% | -0.12% | 0.15% | -0.26% | -0.18% | 0.20% | 0.28% | |
| JPY | -0.81% | -0.58% | -0.15% | -0.65% | -0.60% | -0.16% | -0.10% | |
| CAD | -0.08% | 0.14% | 0.26% | 0.65% | 0.06% | 0.51% | 0.54% | |
| AUD | -0.06% | 0.07% | 0.18% | 0.60% | -0.06% | 0.37% | 0.45% | |
| NZD | -0.53% | -0.32% | -0.20% | 0.16% | -0.51% | -0.37% | 0.08% | |
| CHF | -0.59% | -0.39% | -0.28% | 0.10% | -0.54% | -0.45% | -0.08% |
The heat map shows percentage changes of major currencies against each other. The base currency is picked from the left column, while the quote currency is picked from the top row. For example, if you pick the Japanese Yen from the left column and move along the horizontal line to the US Dollar, the percentage change displayed in the box will represent JPY (base)/USD (quote).
Yen regime seen intact as TD Securities flags scope for USD/JPY drift to 153.00
According to TD Securities, the recent intervention-driven pullback in USD/JPY does not mark a fundamental shift in the currency’s underlying dynamics. The bank argues that, “in the absence of more direct US intervention involvement, we would not see the FX regime as structurally different for JPY.” Strategists at TD Securities add that the “intervention-led USD/JPY selloff could continue moderately to 153.00,” but stress that this would still be consistent with the prevailing framework for the Yen rather than a new regime.
Last week, Japan Ministry of Finance (MoF) confirmed a US-Japan joint intervention to “counter excessive volatility and disorderly movements in the Japanese yen in recent months”.
On Monday, Japan Finance Minister (FM) Satsuki Katayama confirmed that Japan “won't hesitate to carry out more forex intervention with the US”.
USD/JPY Technical Analysis
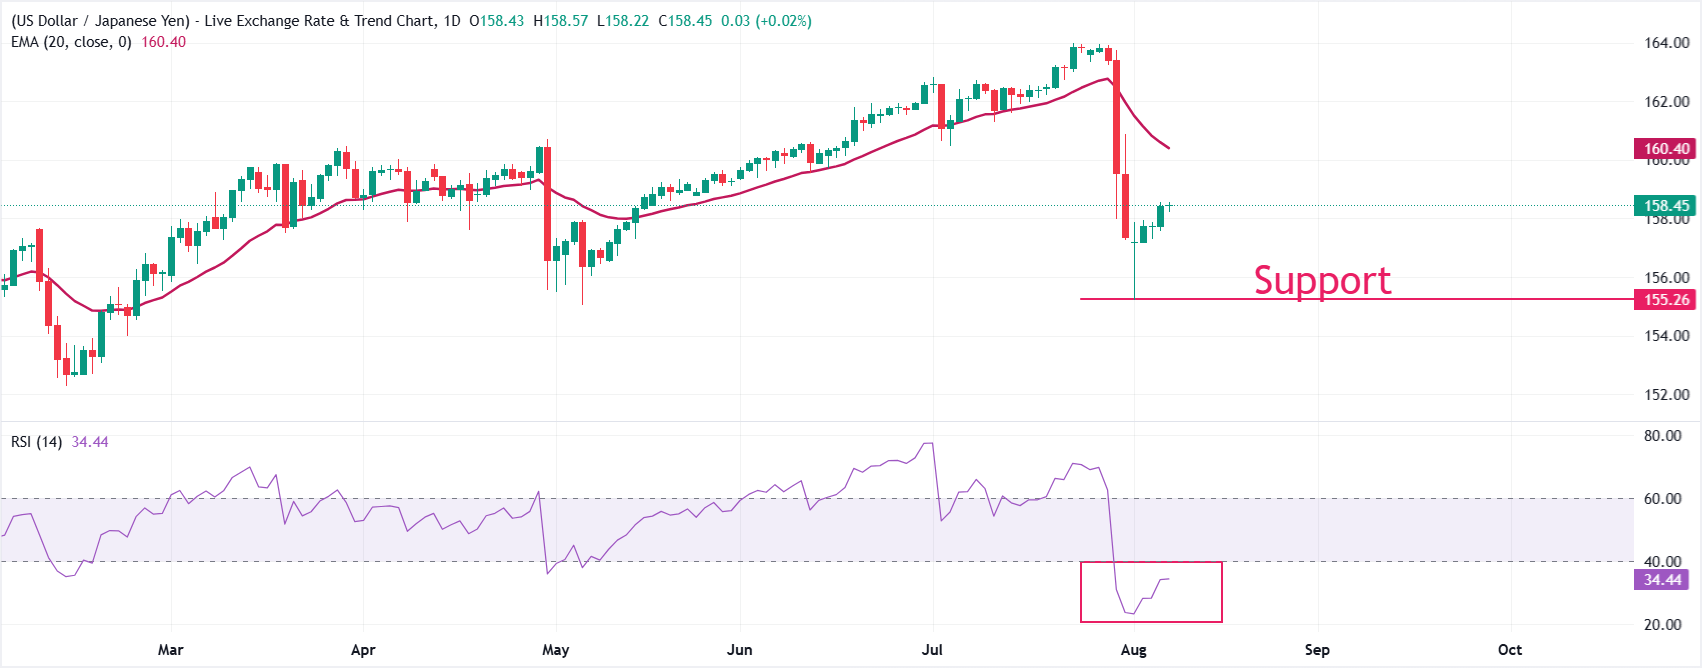
USD/JPY trades firmly at 158.44, maintaining a bearish near-term bias as spot holds below the 20-day exponential moving average (EMA) at 160.40. The pair has retreated sharply from recent highs, and price action remains capped by the overhead EMA, suggesting that recovery attempts are likely to face selling pressure. The Relative Strength Index (RSI) at 34.35 sits just above oversold territory, hinting that while downside momentum has cooled, sellers still retain the upper hand as long as price stays under the 160.40 resistance.
On the topside, initial resistance is located at the 20-day EMA at 160.40, which acts as the first barrier that bulls would need to reclaim to alleviate the current bearish tone. A sustained break above this level would open the way for a deeper corrective rebound, while failure to overcome 160.40 keeps risks skewed toward further downside, with traders watching for the emergence of new structural supports below the current price to define the next potential floor.
(The technical analysis of this story was written with the help of an AI tool. Know more.)
Economic Indicator
Nonfarm Payrolls
The Nonfarm Payrolls release presents the number of new jobs created in the US during the previous month in all non-agricultural businesses; it is released by the US Bureau of Labor Statistics (BLS). The monthly changes in payrolls can be extremely volatile. The number is also subject to strong reviews, which can also trigger volatility in the Forex board. Generally speaking, a high reading is seen as bullish for the US Dollar (USD), while a low reading is seen as bearish, although previous months' reviews and the Unemployment Rate are as relevant as the headline figure. The market's reaction, therefore, depends on how the market assesses all the data contained in the BLS report as a whole.
Read more.Next release: Fri Aug 07, 2026 12:30
Frequency: Monthly
Consensus: 80K
Previous: 57K
Source: US Bureau of Labor Statistics
America’s monthly jobs report is considered the most important economic indicator for forex traders. Released on the first Friday following the reported month, the change in the number of positions is closely correlated with the overall performance of the economy and is monitored by policymakers. Full employment is one of the Federal Reserve’s mandates and it considers developments in the labor market when setting its policies, thus impacting currencies. Despite several leading indicators shaping estimates, Nonfarm Payrolls tend to surprise markets and trigger substantial volatility. Actual figures beating the consensus tend to be USD bullish.
추천 기사


