


NZD/USD Price Forecast: Breaks range, bulls target 0.5950 as RSI turns
- NZD/USD clears 100-day SMA, confirming breakout from rotation area.
- RSI breaks above 50, signaling buyers are gaining momentum.
- Break above 0.5950 exposes 0.6000 and 0.6014 resistance levels.
The New Zealand Dollar advances some 0.48% on Thursday after bottoming near the 200-day Simple Moving Average (SMA) at 0.5836. Over the last two trading days, it cleared the 0.5900 milestone, supported by a hawkish hold by the Reserve Bank of New Zealand (RBNZ).
NZD/USD Price Forecast: Technical outlook
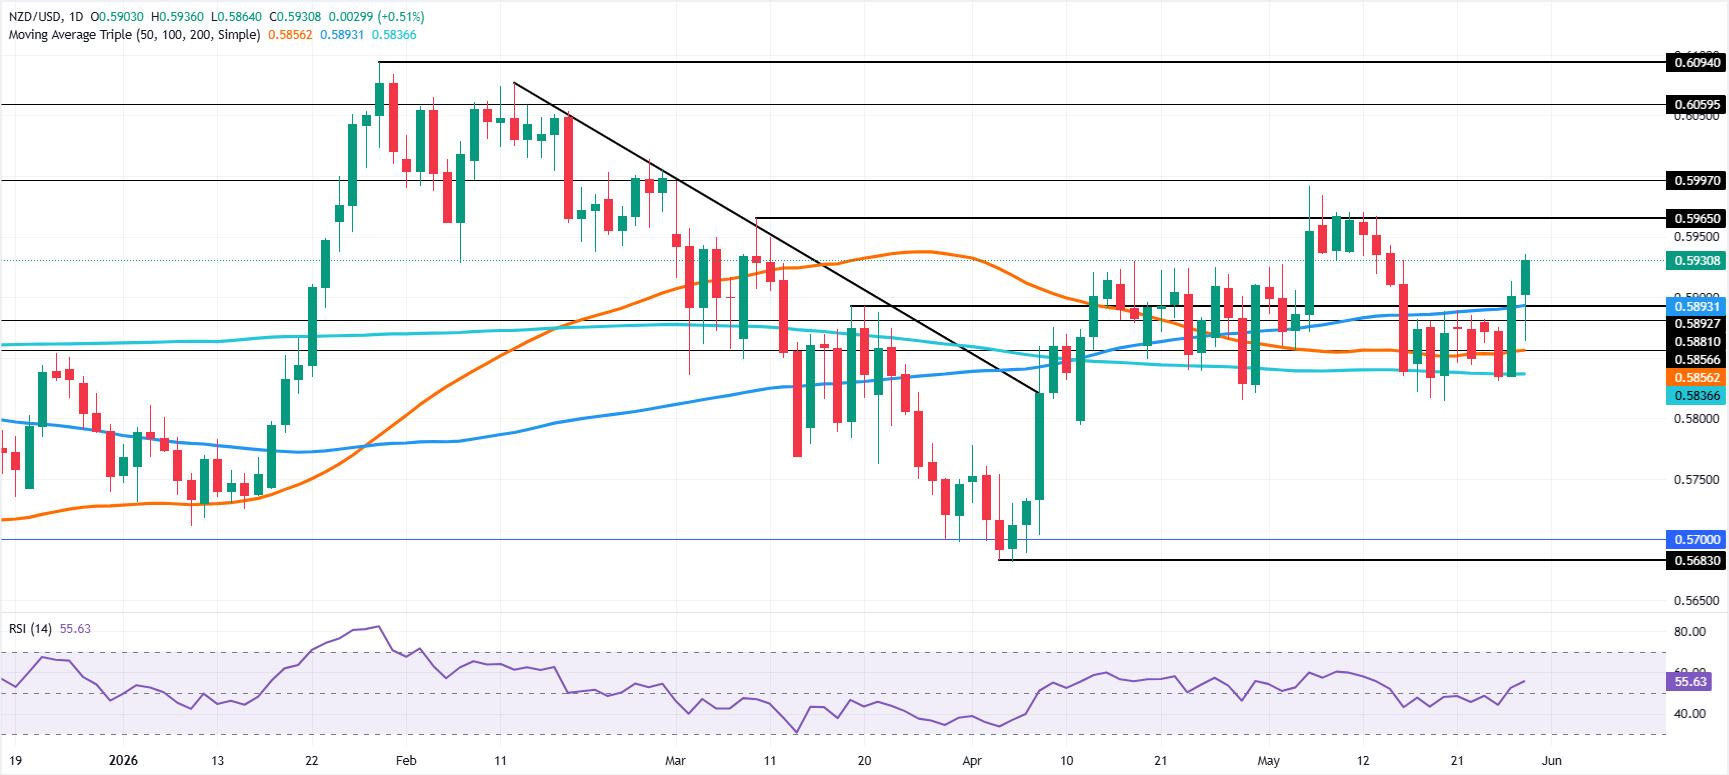
Price action shows the NZD/USD exited a rotation area, capped on the upside by the 100-day SMA at 0.5893, which has so far been cleared by buyers, who are eyeing further upside.
The Relative Strength Index (RSI) shows that buyers are gaining momentum after clearing the 50-neutral level a day ago, on the RBNZ’s decision.
If NZD/USD clears the 0.5950 psychological level, it opens the door to test 0.6000 ahead of the February 26 swing high of 0.6014. If hurdled, the next stop would be the yearly high at 0.6094.
On the downside, sellers must push the NZD/USD below the 100-day SMA, so that they can test the 50-day SMA at 0.5856. Below this level sits the 200-day SMA at 0.5836, followed by the 0.5800 mark.
NZD/USD Price Chart – Daily
New Zealand Dollar Price Today
The table below shows the percentage change of New Zealand Dollar (NZD) against listed major currencies today. New Zealand Dollar was the strongest against the US Dollar.
| USD | EUR | GBP | JPY | CAD | AUD | NZD | CHF | |
|---|---|---|---|---|---|---|---|---|
| USD | -0.18% | -0.09% | -0.16% | -0.41% | -0.29% | -0.50% | -0.41% | |
| EUR | 0.18% | 0.09% | 0.00% | -0.24% | -0.11% | -0.29% | -0.22% | |
| GBP | 0.09% | -0.09% | -0.09% | -0.31% | -0.19% | -0.39% | -0.32% | |
| JPY | 0.16% | 0.00% | 0.09% | -0.26% | -0.13% | -0.34% | -0.24% | |
| CAD | 0.41% | 0.24% | 0.31% | 0.26% | 0.13% | -0.08% | 0.00% | |
| AUD | 0.29% | 0.11% | 0.19% | 0.13% | -0.13% | -0.18% | -0.13% | |
| NZD | 0.50% | 0.29% | 0.39% | 0.34% | 0.08% | 0.18% | 0.07% | |
| CHF | 0.41% | 0.22% | 0.32% | 0.24% | 0.00% | 0.13% | -0.07% |
The heat map shows percentage changes of major currencies against each other. The base currency is picked from the left column, while the quote currency is picked from the top row. For example, if you pick the New Zealand Dollar from the left column and move along the horizontal line to the US Dollar, the percentage change displayed in the box will represent NZD (base)/USD (quote).
추천 기사


