
Silver Price Forecast: XAG/USD dives below $50.00 as the Dollar rallies
- Silver extended losses on risk aversion, reaching two-week lows at $49.20.
- Hopes of a de-escalation of the US-China trade rift have boosted risk appetite, hammering precious metals.
- XAG/USD has broken the neckline of a bearish H&S pattern, targeting levels right above $46.00.
Silver (XAG/USD) is finally correcting lower. Market expectations that the US and China will de-escalate trade tensions are boosting the US Dollar’s recovery and hurting precious metals. Silver has extended its reversal from last week's highs at the $55.00 area, to session lows near $49.00 so far.
US President Trump soothed markets on Monday, announcing that he was planning to meet his Chinese counterpart Xi Jinping next week, and that he expected to reach a “fair deal” which would lead to a good trade relationship between the two countries. These comments tackled fears of a trade war and have sent the US Dollar rallying across the board.
Technical analysis: A bearish H&S pattern is in play
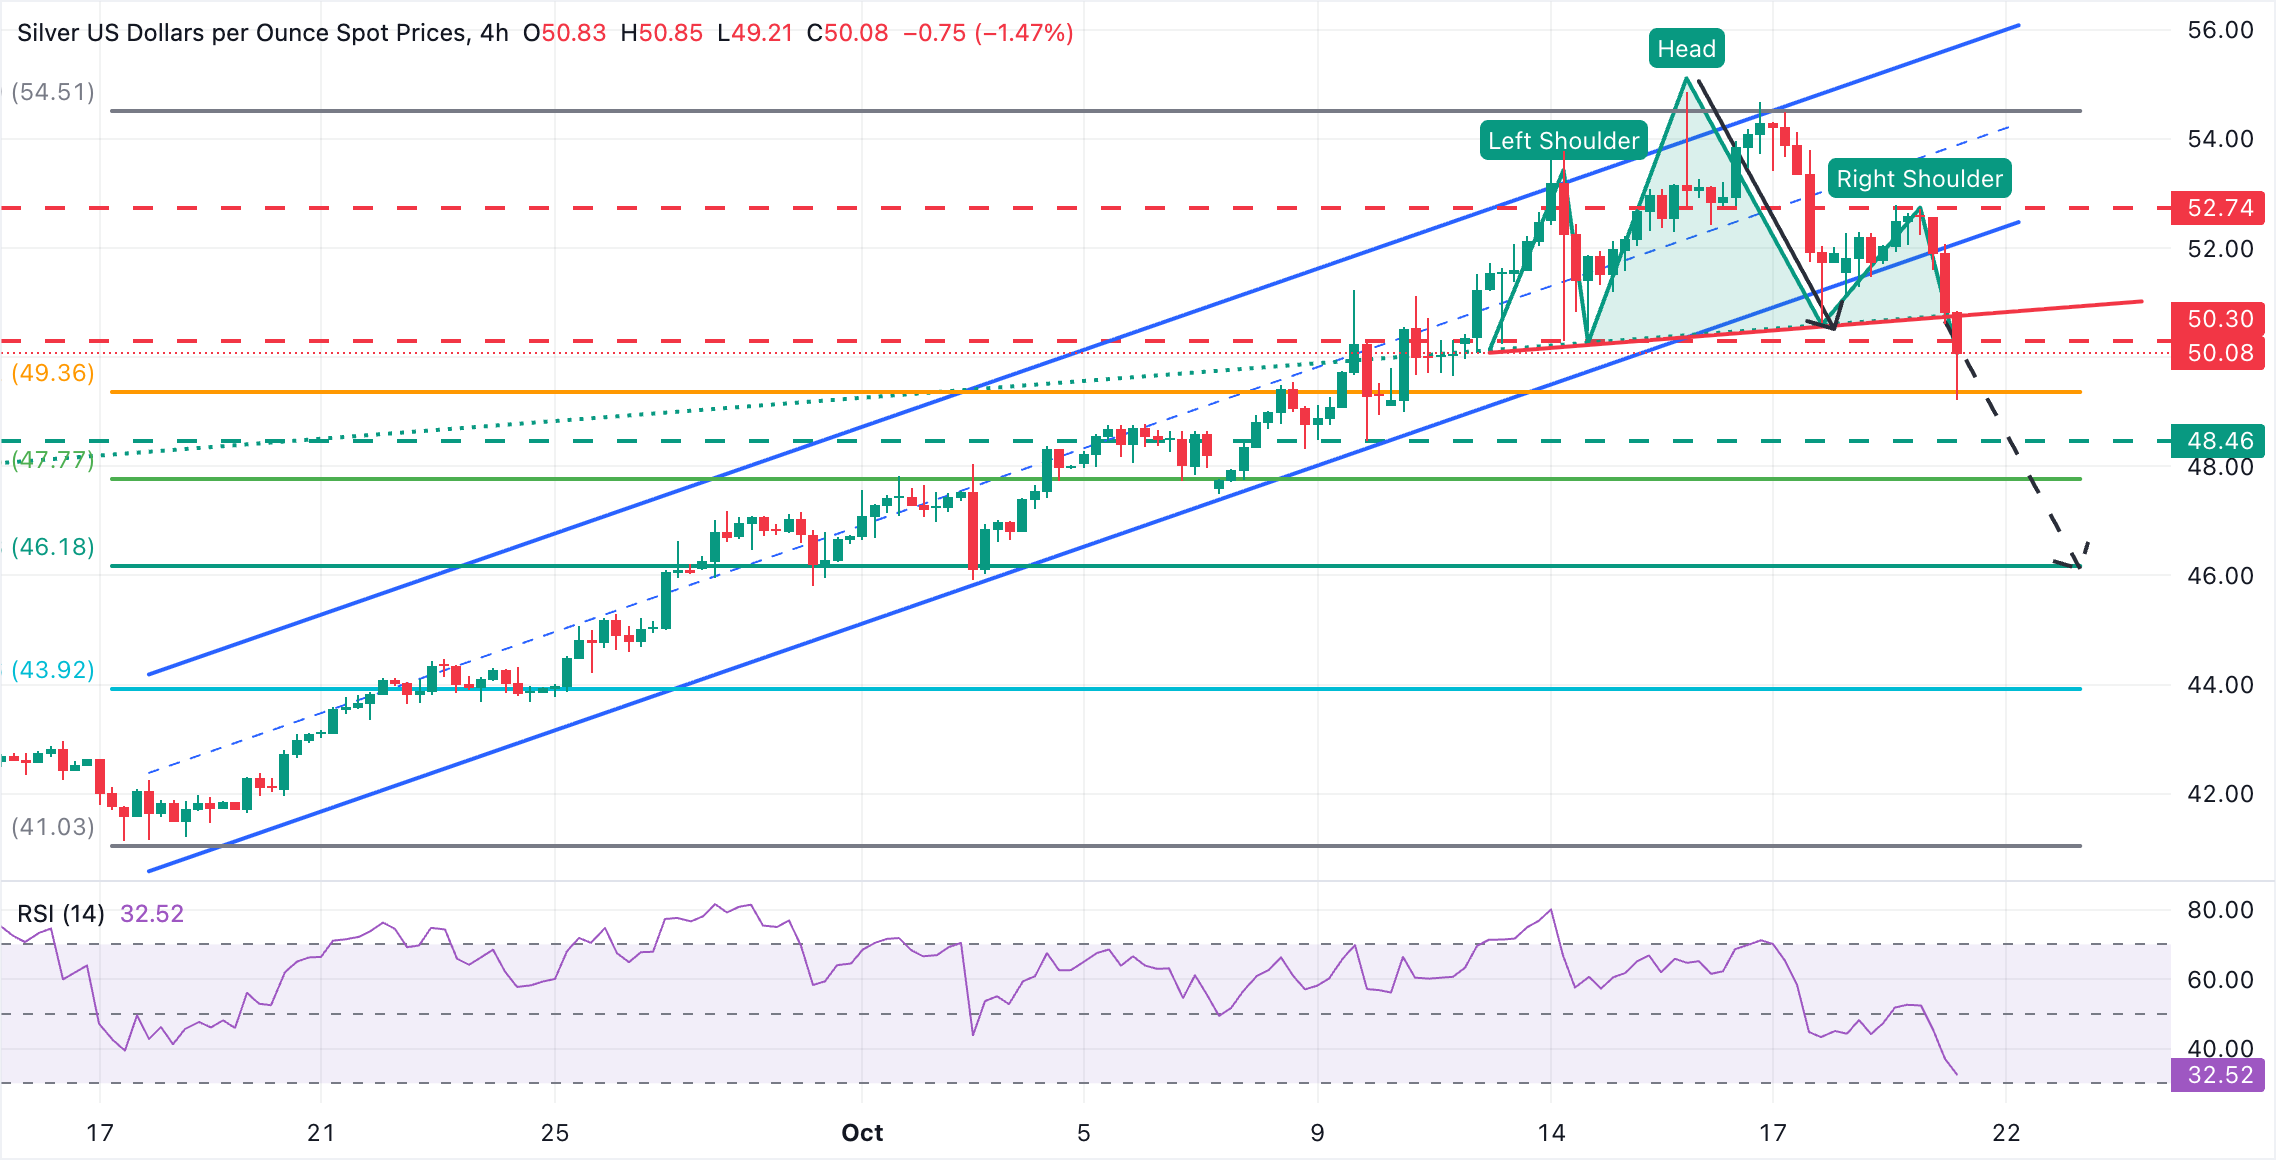
Silver has broken below the base of the ascending channel from mid-September lows and extended losses below the neckline of a bearish Head & Shoulders, a common figure in trend shifts, at the $50.71 area.
The pair is attempting to return above the $50.00 psychological level at the time of writing, and is likely to retest the mentioned H&S neckline, which might act as a resistance now, at the 50.80 area. Further up, the target would be the reverse trendline, near 52.10.
To the downside, intra-day lows are at $49.20 ahead of the October 9 low, at $48.45. The H&S pattern’s measured target is coincident with the 61.8% Fibonacci retracement of the September-October rally, at $46.15.
Silver FAQs
Silver is a precious metal highly traded among investors. It has been historically used as a store of value and a medium of exchange. Although less popular than Gold, traders may turn to Silver to diversify their investment portfolio, for its intrinsic value or as a potential hedge during high-inflation periods. Investors can buy physical Silver, in coins or in bars, or trade it through vehicles such as Exchange Traded Funds, which track its price on international markets.
Silver prices can move due to a wide range of factors. Geopolitical instability or fears of a deep recession can make Silver price escalate due to its safe-haven status, although to a lesser extent than Gold's. As a yieldless asset, Silver tends to rise with lower interest rates. Its moves also depend on how the US Dollar (USD) behaves as the asset is priced in dollars (XAG/USD). A strong Dollar tends to keep the price of Silver at bay, whereas a weaker Dollar is likely to propel prices up. Other factors such as investment demand, mining supply – Silver is much more abundant than Gold – and recycling rates can also affect prices.
Silver is widely used in industry, particularly in sectors such as electronics or solar energy, as it has one of the highest electric conductivity of all metals – more than Copper and Gold. A surge in demand can increase prices, while a decline tends to lower them. Dynamics in the US, Chinese and Indian economies can also contribute to price swings: for the US and particularly China, their big industrial sectors use Silver in various processes; in India, consumers’ demand for the precious metal for jewellery also plays a key role in setting prices.
Silver prices tend to follow Gold's moves. When Gold prices rise, Silver typically follows suit, as their status as safe-haven assets is similar. The Gold/Silver ratio, which shows the number of ounces of Silver needed to equal the value of one ounce of Gold, may help to determine the relative valuation between both metals. Some investors may consider a high ratio as an indicator that Silver is undervalued, or Gold is overvalued. On the contrary, a low ratio might suggest that Gold is undervalued relative to Silver.
추천 기사


