
EUR/USD picks up from lows with Eurozone Services PMI data in focus
- The euro recovers from its lows and returns above 1.1700, but remains confined within its previous ranges.
- Hawkish comments from Dallas Fed President Logan curbed hopes of immediate interest rate cuts on Thursday.
- The Eurozone Services PMI and ECB President Lagarde might guide Euro crosses later in the day.
EUR/USD shows marginal gains on Friday, trading at the 1.1715 area at the time of writing. The pair has been moving in a choppy and volatile manner for the last few days, with the US in a data void, amid the closure of the federal government. In Europe, the Services PMI due later might provide some fundamental guidance for the Euro.
On Thursday, the US Challenger Job Cuts showed a decline in layoffs in September. Still, hiring plans also fell, showing their lowest level since 2009, which confirms that the labour market is deteriorating.
The US Dollar, however, got a boost from Dallas Federal Reserve (Fed) President Lorie Logan, who cooled hopes of an October interest rate cut. Logan supported the 25 basis points (bps) easing in September, but showed concerns about lowering interest rates too fast and said that she is not eager to cut rates further at the next meeting.
The focus this Friday is on September's Eurozone Services Purchasing Managers Index data, which will be observed with interest to assess the impact of US tariffs on the European economy. These figures are likely to set the context for European Central Bank (ECB) President Christine Lagarde, who is expected to meet the press later In the day.
Euro Price Today
The table below shows the percentage change of Euro (EUR) against listed major currencies today. Euro was the strongest against the Japanese Yen.
| USD | EUR | GBP | JPY | CAD | AUD | NZD | CHF | |
|---|---|---|---|---|---|---|---|---|
| USD | -0.02% | -0.00% | 0.37% | -0.01% | 0.07% | -0.02% | 0.00% | |
| EUR | 0.02% | 0.08% | 0.38% | 0.03% | 0.10% | -0.01% | 0.02% | |
| GBP | 0.00% | -0.08% | 0.34% | -0.07% | 0.02% | -0.09% | -0.06% | |
| JPY | -0.37% | -0.38% | -0.34% | -0.38% | -0.32% | -0.41% | -0.39% | |
| CAD | 0.01% | -0.03% | 0.07% | 0.38% | 0.10% | -0.01% | 0.02% | |
| AUD | -0.07% | -0.10% | -0.02% | 0.32% | -0.10% | -0.11% | -0.09% | |
| NZD | 0.02% | 0.00% | 0.09% | 0.41% | 0.01% | 0.11% | 0.03% | |
| CHF | -0.00% | -0.02% | 0.06% | 0.39% | -0.02% | 0.09% | -0.03% |
The heat map shows percentage changes of major currencies against each other. The base currency is picked from the left column, while the quote currency is picked from the top row. For example, if you pick the Euro from the left column and move along the horizontal line to the US Dollar, the percentage change displayed in the box will represent EUR (base)/USD (quote).
Daily digest market movers: Choppy range-bound trading in the absence of US data
- The Euro Dollar is trading without a clear bias, as the US government shutdown has delayed the release of key economic data, namely the US Nonfarm Payrolls scheduled for Friday. In this context, Fed policymakers' opinions are acting as the main driver for US crosses this week.
- In a few moments, the Eurozone's final Services PMI is expected to confirm that the sector's activity accelerated to a 51.4 reading in September from 50.1 in August, showing the strongest expansion so far this year.
- Eurozone data released on Thursday revealed that the Unemployment Rate in the countries sharing the Euro (EUR) increased unexpectedly to 6.3% in August, from 6.2% in July. The impact of these figures on the Euro, however, was muted.
- In the US, the Challenger Job Cuts showed a decline to 54,064 in September from 85,979 in August, although hiring plans have shown a total of 204,939 so far this year, which is the lowest since 2009 in the midst of the financial crisis.
Technical Analysis: EUR/USD is trading sideways below the 1.1760 resistance area
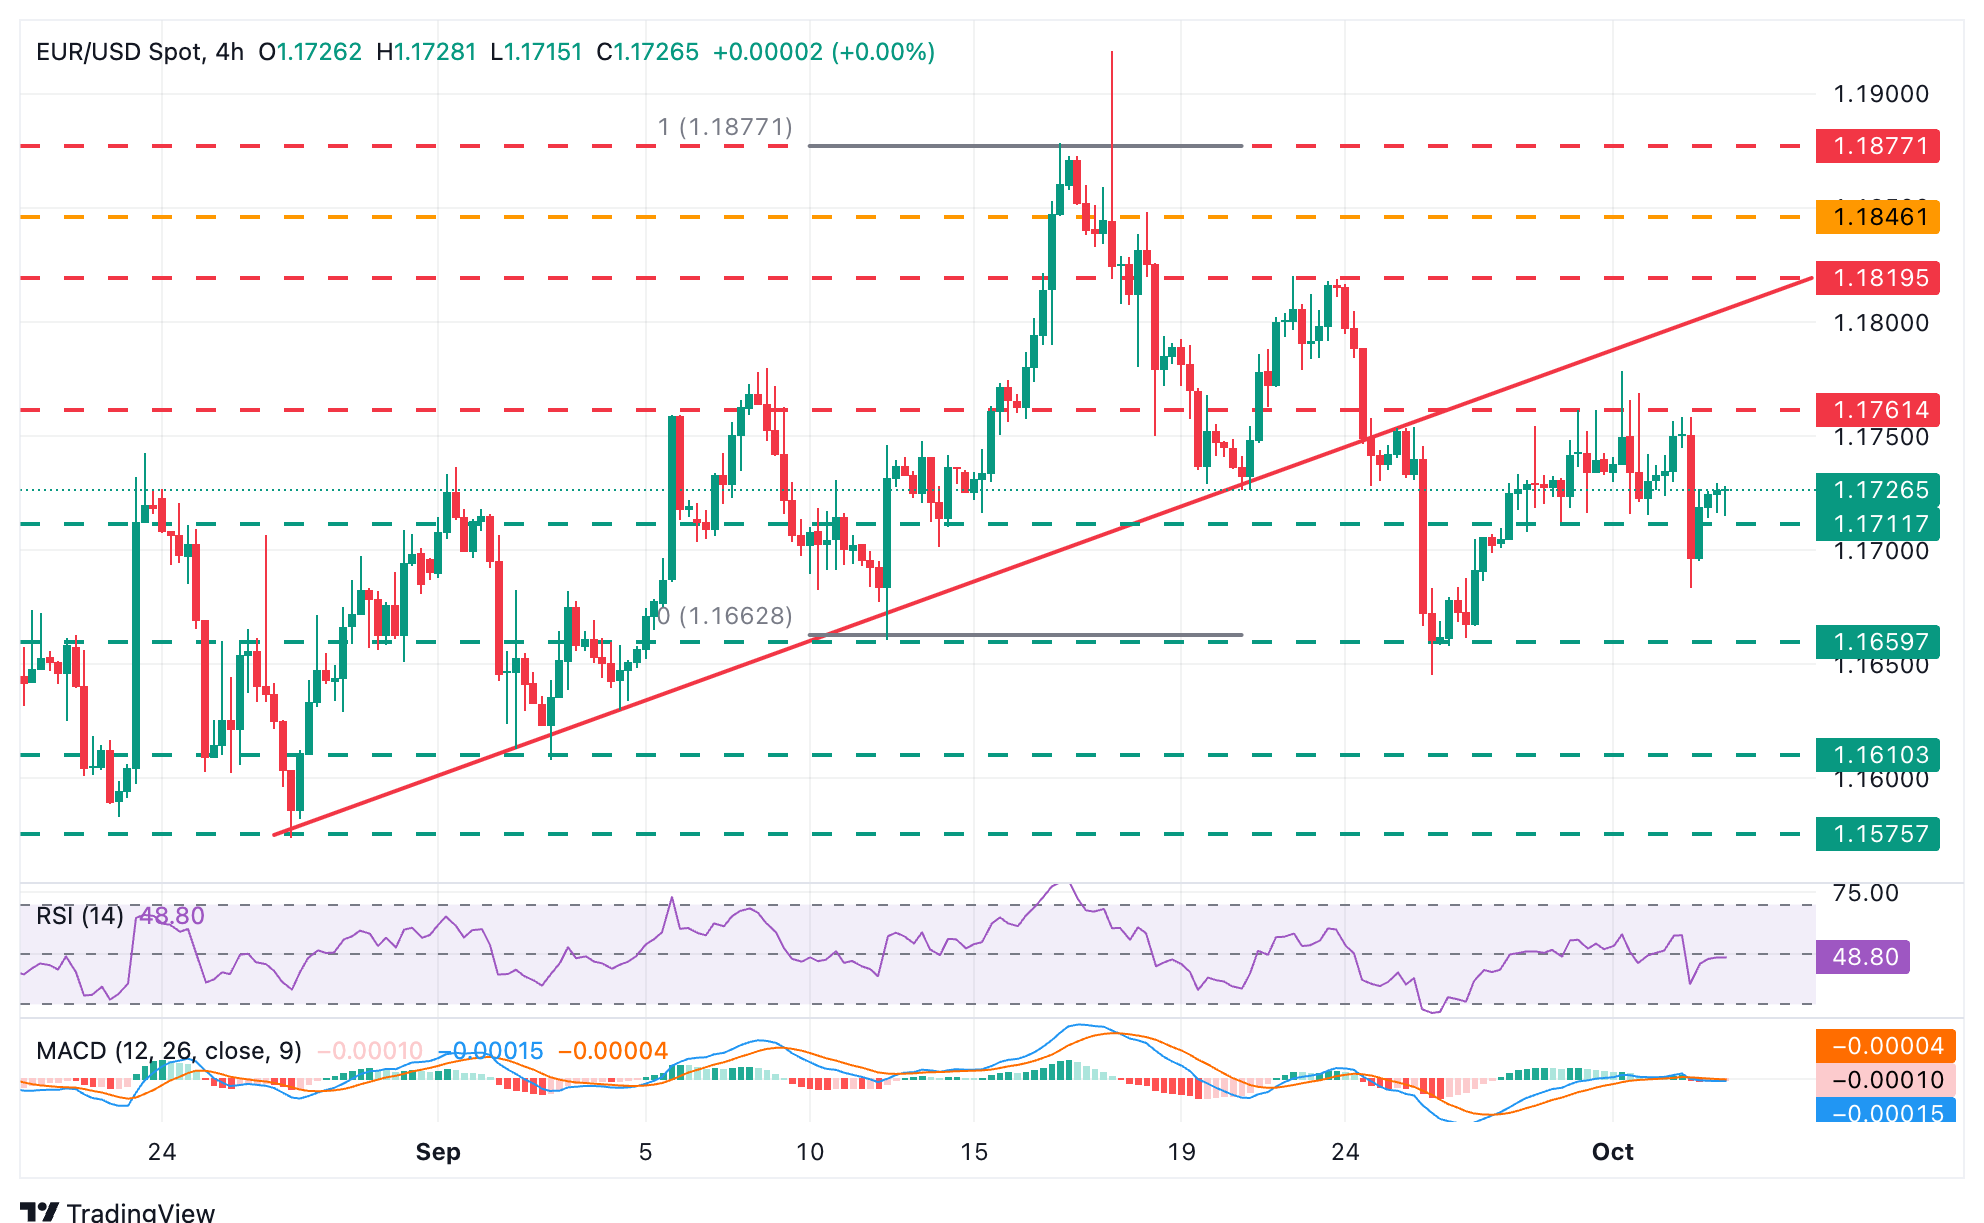
EUR/USD recovery from last week's lows has lost momentum, and the pair is looking for direction below within a horizontal range roughly between 1.1700 and 1.1760. The 4-hour chart Relative Strength Index (RSI) is wavering around the 50 neutral level, and the Moving Average Convergence Divergence (MACD) is flat at the signal line, suggesting a lack of a clear bias.
Immediate resistances are at Thursday's high near 1.1760 and a reverse trendline from late-August lows, now around 1.1800. Failure to return above those levels might give fresh hopes for bears to resume the bearish trend from mid-September highs, above 1.1800.
To the downside, immediate support is at Thursday's low, near 1.1685, ahead of last week's lows at the 1.1645-1.1655 area. Further down, the target is the September 2 and 3 lows, near 1.1610.
Economic Indicator
HCOB Services PMI
The Services Purchasing Managers Index (PMI), released on a monthly basis by S&P Global and Hamburg Commercial Bank (HCOB), is a leading indicator gauging business activity in the Eurozone services sector. As the services sector dominates a large part of the economy, the Services PMI is an important indicator gauging the state of overall economic conditions. The data is derived from surveys of senior executives at private-sector companies from the services sector. Survey responses reflect the change, if any, in the current month compared to the previous month and can anticipate changing trends in official data series such as Gross Domestic Product (GDP), industrial production, employment and inflation. The index varies between 0 and 100, with levels of 50.0 signaling no change over the previous month. A reading above 50 indicates that the services economy is generally expanding, a bullish sign for the Euro (EUR). Meanwhile, a reading below 50 signals that activity among services providers is generally declining, which is seen as bearish for EUR.
Read more.Next release: Fri Oct 03, 2025 08:00
Frequency: Monthly
Consensus: 51.4
Previous: 51.4
Source: S&P Global
Economic Indicator
HCOB Composite PMI
The Composite Purchasing Managers’ Index (PMI), released on a monthly basis by S&P Global and Hamburg Commercial Bank (HCOB), is a leading indicator gauging private-business activity in the Eurozone for both the manufacturing and services sectors. The data is derived from surveys to senior executives. Each response is weighted according to the size of the company and its contribution to total manufacturing or services output accounted for by the sub-sector to which that company belongs. Survey responses reflect the change, if any, in the current month compared to the previous month and can anticipate changing trends in official data series such as Gross Domestic Product (GDP), industrial production, employment and inflation. The index varies between 0 and 100, with levels of 50.0 signaling no change over the previous month. A reading above 50 indicates that the private economy is generally expanding, a bullish sign for the Euro (EUR). Meanwhile, a reading below 50 signals that activity is generally declining, which is seen as bearish for EUR.
Read more.Next release: Fri Oct 03, 2025 08:00
Frequency: Monthly
Consensus: 51.2
Previous: 51.2
Source: S&P Global
mid-September
추천 기사


