


Kraft Heinz vs. PepsiCo: Which Consumer Goods Stock Is a Better Buy for 2027?
Key Points
Kraft Heinz maintains a significant presence in the global food market but faces high customer concentration with its largest retail partner.
PepsiCo continues to drive steady growth through its massive beverage portfolio and snack food divisions across more than 200 countries.
Which established brand giant is better positioned for your investment portfolio as we look toward 2027?
- 10 stocks we like better than Kraft Heinz ›
As consumer habits shift toward value and health, established giants Kraft Heinz (NYSE:KHC) and PepsiCo (NASDAQ:PEP) are competing for both kitchen pantry dominance and a spot in your long-term portfolio.
Kraft Heinz focuses primarily on meal essentials and condiments, while PepsiCo balances a diverse empire of beverages and snacks. Investors often compare them to determine which company offers a better mix of defensive stability and valuation.
The case for Kraft Heinz
Kraft Heinz operates a diverse portfolio of brands among consumer staples stocks, focusing on condiments, cheese, and prepared meals. Its products reach consumers through retail and foodservice channels in approximately 40 countries. Walmart (NASDAQ:WMT) accounted for roughly 21% of net sales in 2025, and customer concentration like this adds a layer of risk to the business.
In the 12 months ended Sept. 26, 2026, revenue reached nearly $24.8 billion. This represented a decrease of approximately 1.5% compared to the prior period, continuing a recent downward trend in total sales. The company reported a net loss of close to $3.5 billion, resulting in a negative net margin of roughly 14%.
As of its December 2025 balance sheet, the debt-to-equity ratio is approximately 0.5. This ratio compares total debt to shareholder equity to measure financial leverage. The current ratio, which measures the ability to pay short-term debts with short-term assets, is roughly 1.2. In the fiscal year ended Dec. 27, 2025, free cash flow was nearly $3.7 billion.
The case for PepsiCo
PepsiCo manages a vast portfolio of snacks and drinks across 200 countries and territories. Its largest customer is Walmart and its affiliates, which represented nearly 14% of consolidated net revenue in 2025. Customer concentration like this adds a layer of risk to the business, though the company maintains a strong global distribution network.
In the 12 months ended Sept. 5, 2026, revenue reached nearly $98.2 billion. This reflects revenue growth of approximately 6.4% over the preceding 12 months, following a period of steady annual increases. The company reported net income of roughly $10.9 billion, resulting in a net margin of approximately 11.1%.
As of Pepsi's December 2025 balance sheet, the debt-to-equity ratio is roughly 2.4. The current ratio is approximately 0.9, suggesting short-term liabilities slightly exceed short-term assets. In the fiscal year ended Dec. 27, 2025, free cash flow was nearly $7.7 billion.
Risk profile comparison
Kraft Heinz faces intense competition from both national brands and private label alternatives. Fluctuations in commodity prices and energy costs often impact its bottom line despite active hedging strategies. The company also navigates regulatory risks, including litigation over its "ultra-processed" labels, and uncertainty following the pause of its proposed spin-off in early 2026.
PepsiCo is susceptible to volatility in raw material and packaging prices, which can disrupt global supply chains. It faces aggressive competition from Coca-Cola (NYSE:KO) and other international beverage players. Additionally, the business must manage evolving health regulations like sugar taxes and legal challenges regarding advertising claims for its snack products.
Valuation comparison
Kraft Heinz looks cheaper based on its forward P/E, while PepsiCo trades at a higher P/S ratio relative to sales over the past 12 months.
The forward P/E compares the current stock price to future earnings estimates.
| Metric | Kraft Heinz | PepsiCo |
|---|---|---|
| Forward P/E | 11.7 | 16.9 |
| P/S ratio | 1.2 | 2.0 |
Valuation metrics include sourcing from Financial Modeling Prep (FMP) and may differ from other data providers.
Which stock would I buy for 2027?
Kraft Heinz's 2015 merger is largely seen as a failure. The combined company's shares peaked in 2017 and have headed steadily lower ever since. It's little wonder why Kraft Heinz announced plans to split up in 2025 (which it later abandoned).
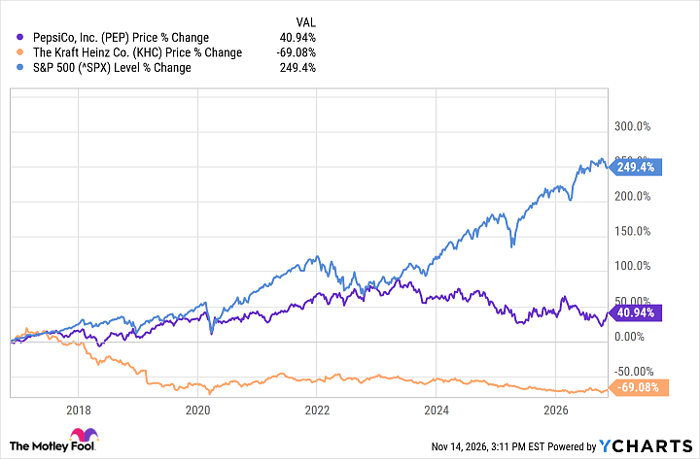
PEP data by YCharts
I like a dividend-paying stock, and Kraft Heinz shares yield a hefty 6.4%. However, yield and share price have an inverse relationship; a yield rises as a stock's price falls. That elevated yield, to me, indicates investors are bailing on the company.
Pepsi's performance hasn't been amazing over the past 10 or so years; the S&P 500 has gained 200 percentage points more than the soda giant over that time frame. But Pepsi is the classic example of a consumer defensive stock: a set-it-and-forget dividend payer that provides ballast in your portfolio. Between these two consumer names, I think Pepsi looks like a better bet for 2027 and beyond.
Should you buy stock in Kraft Heinz right now?
Before you buy stock in Kraft Heinz, consider this:
The Motley Fool Stock Advisor analyst team just identified what they believe are the 10 best stocks for investors to buy now… and Kraft Heinz wasn’t one of them. The 10 stocks that made the cut could produce monster returns in the coming years.
Consider when Netflix made this list on December 17, 2004... if you invested $1,000 at the time of our recommendation, you’d have $335,171!* Or when Nvidia made this list on April 15, 2005... if you invested $1,000 at the time of our recommendation, you’d have $1,000,640!*
Now, it’s worth noting Stock Advisor’s total average return is 823% — a market-crushing outperformance compared to 208% for the S&P 500. Don't miss the latest top 10 list, available with Stock Advisor, and join an investing community built by individual investors for individual investors.
See the 10 stocks »
*Stock Advisor returns as of November 15, 2026.
Erin Kennedy has no position in any of the stocks mentioned. The Motley Fool has positions in and recommends Walmart. The Motley Fool recommends Kraft Heinz. The Motley Fool has a disclosure policy.
Recommended Articles


