

Warren Buffett Issued His Starkest Warning About the Stock Market in Years. Here's What History Says Comes Next.

Source The Motley Fool

Key Points

  • The market experienced its worst week of the year in early November.

  • Warren Buffett warns that some investors may be taking on too much risk right now.

  • History says the short term could be shaky, but the market's long-term future is bright.

  • Motley Fool Issues Rare "Total Conviction" Buy Alert ›

There's been no shortage of market volatility over the last week. After experiencing their worst week of 2026 in early November, the S&P 500 (SNPINDEX:^GSPC), Nasdaq Composite (NASDAQINDEX:^IXIC), and Dow Jones Industrial Average (DJINDICES:^DJI) are rallying once again.

However, that doesn't mean that investors are in the clear. The tech industry is still struggling with volatility -- especially after Nvidia CEO Jensen Huang's recent ousting -- and the market is the priciest it's been in decades.

Missed Nvidia in 2009? This Rare Signal Is Flashing Again. In 2009, a "Double Down" signal flashed for a little-known chipmaker called Nvidia. For the first time in years, that same "Total Conviction" signal is flashing for a company 1/100th the size of Nvidia. Continue »

Warren Buffett has also issued a direct warning to investors who may be underestimating market risk right now, and history has both good and bad news about what's coming next.

Warren Buffett wearing glasses speaks to reporters at a crowded indoor event.

Warren Buffett. Image source: The Motley Fool.

Buffett warns that some investors are "gambling"

During Berkshire Hathaway's 2026 meeting, Buffett discussed his thoughts on the current market in an interview with CNBC. He warned that in this historically expensive market, some investors are taking on too much risk.

"I've compared the markets to a church with a casino attached," he noted, with the church representing fundamentals-based long-term investing and the casino depicting short-term buying.

[T]he casino has gotten very attractive to people," Buffett warned, adding, "that's not investing, it's not speculating, it's gambling." He emphasized, however, that "that doesn't mean that investing is terrible. It does mean that prices for an awful lot of things will look very silly."

What history says is coming next

The S&P 500 has notched more than two dozen record highs so far in 2026, but the downside to all of that growth is that some stocks are at risk of becoming overvalued.

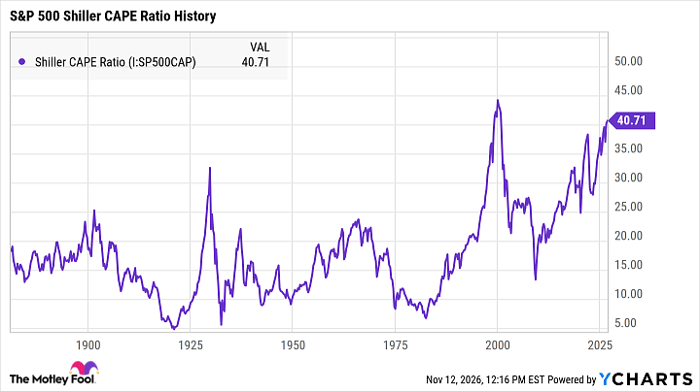
The S&P 500 Shiller CAPE Ratio measures the S&P 500's valuation over time based on its 10-year inflation-adjusted earnings. The higher the metric climbs, the more likely the index is overvalued and due for a pullback.
Shiller CAPE Ratio Chart

Shiller CAPE Ratio data by YCharts

While no market indicator can predict when recessions or bear markets will begin, this particular metric has a long track record of preceding downturns. In 1929, for example, it spiked just before the Great Depression began. It surged again in 1999, during the dot-com bubble. Most recently, it peaked in late 2021, just months before stocks sank into a bear market.

In 2026, this metric reached its highest level since the dot-com bubble burst -- surpassing 40 for only the second time in stock market history. While this doesn't necessarily mean a crash is imminent, it does mean the market is incredibly richly valued right now.

There's still good news for investors

The market may be pricey, but that doesn't mean it's a bad time to buy. It's crucial, however, to maintain a long-term outlook.

As Buffett mentioned, not all investing is bad. While some stocks may be overvalued right now, there are still plenty of fairly priced and even undervalued stocks with plenty of room for growth.
^SPX Chart

^SPX data by YCharts

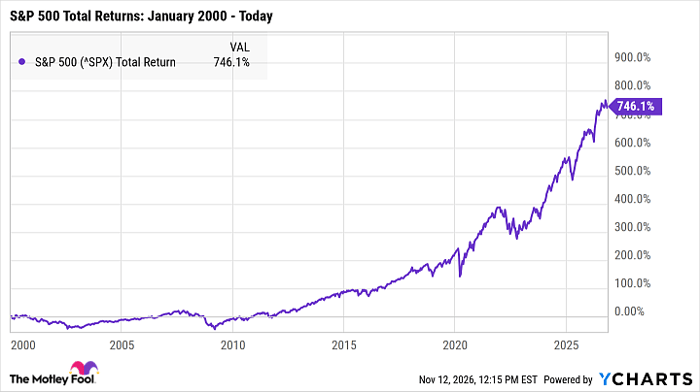
History also proves time and again that quality stocks will thrive over time. Since 2000, for example, the S&P 500 has faced the dot-com bubble, the Great Recession, the COVID-19 crash, the 2022 bear market, and countless smaller corrections along the way. It's also up by nearly 750% in that time.

It's impossible to say where the market is headed in the near term. But if history has just one lesson for investors, it's that healthy stocks and a long-term outlook are the keys to surviving whatever volatility may be looming.

Should you buy stock in S&P 500 Index right now?

Before you buy stock in S&P 500 Index, consider this:

The Motley Fool Stock Advisor analyst team just identified what they believe are the 10 best stocks for investors to buy now… and S&P 500 Index wasn’t one of them. The 10 stocks that made the cut could produce monster returns in the coming years.

Consider when Netflix made this list on December 17, 2004... if you invested $1,000 at the time of our recommendation, you’d have $335,171!* Or when Nvidia made this list on April 15, 2005... if you invested $1,000 at the time of our recommendation, you’d have $1,000,640!*

Now, it’s worth noting Stock Advisor’s total average return is 823% — a market-crushing outperformance compared to 208% for the S&P 500. Don't miss the latest top 10 list, available with Stock Advisor, and join an investing community built by individual investors for individual investors.

See the 10 stocks »

*Stock Advisor returns as of November 14, 2026.

Katie Brockman has no position in any of the stocks mentioned. The Motley Fool has positions in and recommends Berkshire Hathaway and Nvidia. The Motley Fool has a disclosure policy.

Disclaimer: For information purposes only. Past performance is not indicative of future results.
placeholder
Gold Price Analysis Today | Forex Gold Analysis | XAU/USD Analysis - November 11, 2026Get the latest gold price analysis, forex gold insights, and XAU/USD analysis for November 11, 2026. Read on for the details.
Author  Mitrade
Nov 11, Wed
Get the latest gold price analysis, forex gold insights, and XAU/USD analysis for November 11, 2026. Read on for the details.
placeholder
Bitcoin lost its 200-day average — but the exit started three sessions before the CPIBitcoin fell 2.5% to about $73,400 on 11 November, an 11-week low, breaking its 200-day moving average near $73,100. The 24-hour liquidation tally reached $632 to $705 million, roughly 82% of it longs. But spot ETF outflows began three sessions earlier and USDT's market cap has shrunk $6.6 billion in 60 days — the leveraged length left before the inflation print did. A double top at 81,890 and 81,080 leaves a measured target of 69,366.
Author  Suzie
Nov 11, Wed
Bitcoin fell 2.5% to about $73,400 on 11 November, an 11-week low, breaking its 200-day moving average near $73,100. The 24-hour liquidation tally reached $632 to $705 million, roughly 82% of it longs. But spot ETF outflows began three sessions earlier and USDT's market cap has shrunk $6.6 billion in 60 days — the leveraged length left before the inflation print did. A double top at 81,890 and 81,080 leaves a measured target of 69,366.
placeholder
Nvidia slid 7.7% after hours while AMD and Broadcom rose — the AI trade changed hands, it didn't breakNvidia closed Wednesday at 173.73, up 2.87%, then fell as much as 8.1% to 159.44 after reports that its board was preparing for a possible leadership change. The same session, the Philadelphia Semiconductor Index rose 5.7% with all 30 components higher, CoreWeave jumped 24.7% on 168% revenue growth, and Micron added 11.9%. If AI demand were being repriced, AMD and Broadcom would not be bid. This is a governance discount on one name, and 204.54 — the 200-day average — is the level that settles it.
Author  Irene Q.
Nov 12, Thu
Nvidia closed Wednesday at 173.73, up 2.87%, then fell as much as 8.1% to 159.44 after reports that its board was preparing for a possible leadership change. The same session, the Philadelphia Semiconductor Index rose 5.7% with all 30 components higher, CoreWeave jumped 24.7% on 168% revenue growth, and Micron added 11.9%. If AI demand were being repriced, AMD and Broadcom would not be bid. This is a governance discount on one name, and 204.54 — the 200-day average — is the level that settles it.
placeholder
Gold hit a one-year low while central banks bought 321 tonnes — the sellers were never the ones you thinkSpot gold closed at 3,876 on Thursday, down 2.8% and its lowest close in more than a year, with an intraday low near 3,852. The dollar is at a 19-month high of 103.21 and the 10-year yield is at 5.10%, so the price move is easy to explain. What is harder to explain is who sold: central banks bought 321 tonnes in Q3, the PBoC added for a 24th straight month, ETF holdings are near a record 4,256 tonnes, and roughly 95% of the futures selling came from non-reportable and sovereign-type accounts rather than hedge funds. This piece separates the two books that have to balance.
Author  Irene Q.
Yesterday 02: 40
Spot gold closed at 3,876 on Thursday, down 2.8% and its lowest close in more than a year, with an intraday low near 3,852. The dollar is at a 19-month high of 103.21 and the 10-year yield is at 5.10%, so the price move is easy to explain. What is harder to explain is who sold: central banks bought 321 tonnes in Q3, the PBoC added for a 24th straight month, ETF holdings are near a record 4,256 tonnes, and roughly 95% of the futures selling came from non-reportable and sovereign-type accounts rather than hedge funds. This piece separates the two books that have to balance.
placeholder
Brent rose 3.3% and US crude stocks built 4.66 million barrels in the same weekBrent January settled at 95.82, up 3.3%, and WTI at 88.74, up 2.55%, after the US signalled it would not pursue a deal with Iran and attacks on Gulf shipping continued. In the same week, EIA data showed US crude inventories rising 4.657 million barrels against expectations of a 1.1 million draw, with gasoline up another 1.799 million. OPEC output also rebounded 1.96 million barrels a day to 27.16 million in October, led by Saudi Arabia at 10.56 million. This piece separates the geopolitical premium from the physical balance and lays out where each side of the trade is anchored.
Author  Irene Q.
Yesterday 03: 06
Brent January settled at 95.82, up 3.3%, and WTI at 88.74, up 2.55%, after the US signalled it would not pursue a deal with Iran and attacks on Gulf shipping continued. In the same week, EIA data showed US crude inventories rising 4.657 million barrels against expectations of a 1.1 million draw, with gasoline up another 1.799 million. OPEC output also rebounded 1.96 million barrels a day to 27.16 million in October, led by Saudi Arabia at 10.56 million. This piece separates the geopolitical premium from the physical balance and lays out where each side of the trade is anchored.
goTop
quote