

SpaceX Stock Price Forecast: Morgan Stanley Maintains Overweight Rating, Sets $300 Price Target, Sees Over 100% Upside

Source Tradingkey

TradingKey - Recently, SpaceX shares (SPCX) entered a volatile recovery phase following a sharp pullback. As of November 12 Eastern Time, SPCX edged up 0.14% to close at $139.94, reaching an intraday high of $147.60 on volume of approximately 95.96 million shares; in the latest overnight trading, it briefly climbed back above $141. Compared to the interim low of $120.39 on November 5, the stock has rebounded about 16%, but there is still more than 100% upside potential to JPMorgan's $300 price target.

Morgan Stanley Maintains $300 Price Target, Eyes New Growth Curve After Neocloud

Morgan Stanley recently reiterated its Overweight rating and $300 price target on SpaceX. The bank believes SpaceX is gradually moving past the rapid expansion phase of its Neocloud business, with the company's future growth focus potentially shifting further toward robotics, mesh networking, and space infrastructure. Morgan Stanley estimates that by the end of 2027, SpaceX's computing capacity will be slightly above 8 GW, below the more than 13 GW target proposed by Musk, with key constraints including chips, power, and financing capacity. The bank also expects that as the business mix shifts, Neocloud's share of total revenue and profit may gradually decline.

Meanwhile, Morgan Stanley further views SpaceX as an infrastructure player in "Physical AI." The rationale is that as the deployment of robots and distributed AI devices increases, demand for computing, network connectivity, and low-latency data transmission is likely to expand, while Starlink, launch capabilities, and AI computing facilities position SpaceX to span connectivity, compute power, and space infrastructure. The bank estimates the addressable market for digital AI at approximately $30 trillion and believes the long-term addressable market for physical AI could be even larger. However, this valuation framework relies on the widespread adoption of robotics, declining space computing costs, and projects like Terafab progressing as planned; hence, the $300 price target primarily reflects long-term business expansion assumptions rather than near-term profitability.

From an execution standpoint, SpaceX continues to ramp up its AI infrastructure investment. The company recently unveiled plans to build supercomputing facilities in Texas and Arizona with a total investment exceeding $74 billion, while Morgan Stanley is closely watching the investment scale and construction progress of Terafab's next phase. Whether the stock can further digest the growth expectations implied by the $300 price target will largely depend on AI infrastructure utilization rates, the commercialization of the robotics business, and the pace at which capital investment converts into revenue and cash flow.

SpaceX Stock Price Technical Analysis
spcx-a3aef7d016f64726bdc582b9a7bc6ec3

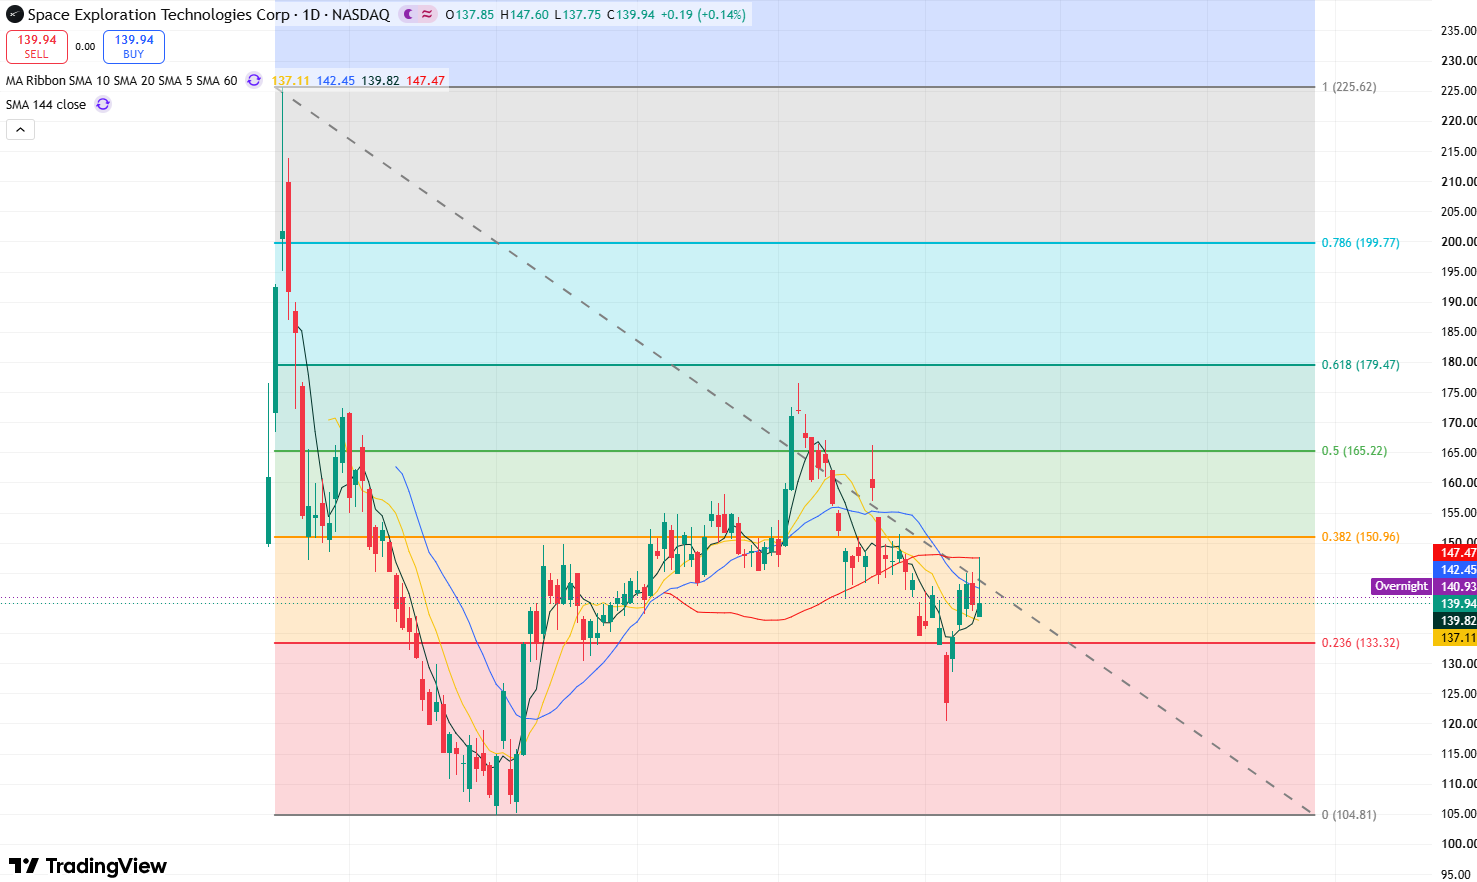
SPCX daily stock price chart, Source: TradingView

Judging from the daily chart of SPCX, the stock price rebounded sharply after falling to a low near $120 in early November and has now returned to around $140. However, it has not yet effectively broken above the key resistance level of $143, meaning the current trend remains in a recovery phase within a short-term downtrend.

In terms of moving averages, the 5-day moving average is currently around $139.82, the 10-day moving average is around $137.11, the 20-day moving average is around $142.45, and the 60-day moving average is around $147.47. The latest closing price of $139.94 has climbed back above the 5-day and 10-day moving averages, improving the short-term price structure. However, it remains below the 20-day and 60-day moving averages, indicating that the medium-term trend has not yet fully strengthened. Only when the stock price successfully breaks out and stabilizes above the 60-day moving average can the medium-term trend potentially reverse to an uptrend.

From the perspective of Fibonacci retracement levels, the $130-$133 area corresponds to the 0.236 retracement level of the previous rally and serves as key support formed during the recent rebound. If this zone holds, the stock still has room to test overhead resistance levels; if it breaks below this area again, the next support to watch will return to the $120-$124 range.

Currently, the stock price remains under short-term pressure below the key resistance level of $143. If it can effectively break above this level, it will open up continuation upside toward $150, with the next resistance at $165. Clearing this resistance would allow the stock to further challenge its Oct. 6 high of $176.42, and only a breakout above this level would pave the way for a test of the $200 mark or even its all-time high of $225.64.

Disclaimer: For information purposes only. Past performance is not indicative of future results.
placeholder
Gold Price Analysis Today | Forex Gold Analysis | XAU/USD Analysis - November 11, 2026Get the latest gold price analysis, forex gold insights, and XAU/USD analysis for November 11, 2026. Read on for the details.
Author  Mitrade
Nov 11, Wed
Get the latest gold price analysis, forex gold insights, and XAU/USD analysis for November 11, 2026. Read on for the details.
placeholder
Nvidia slid 7.7% after hours while AMD and Broadcom rose — the AI trade changed hands, it didn't breakNvidia closed Wednesday at 173.73, up 2.87%, then fell as much as 8.1% to 159.44 after reports that its board was preparing for a possible leadership change. The same session, the Philadelphia Semiconductor Index rose 5.7% with all 30 components higher, CoreWeave jumped 24.7% on 168% revenue growth, and Micron added 11.9%. If AI demand were being repriced, AMD and Broadcom would not be bid. This is a governance discount on one name, and 204.54 — the 200-day average — is the level that settles it.
Author  Irene Q.
Nov 12, Thu
Nvidia closed Wednesday at 173.73, up 2.87%, then fell as much as 8.1% to 159.44 after reports that its board was preparing for a possible leadership change. The same session, the Philadelphia Semiconductor Index rose 5.7% with all 30 components higher, CoreWeave jumped 24.7% on 168% revenue growth, and Micron added 11.9%. If AI demand were being repriced, AMD and Broadcom would not be bid. This is a governance discount on one name, and 204.54 — the 200-day average — is the level that settles it.
placeholder
US October PPI Preview: Fed Rate Hike Expectations Rise, PPI May Be Key Variable; How Will US Stocks, Dollar, and Gold Move?On Friday (Nov. 13) Eastern Time, the U.S. will release the October Producer Price Index (PPI). Following the October CPI once again exceeding expectations, the market will look to the PP
Author  TradingKey
Nov 12, Thu
On Friday (Nov. 13) Eastern Time, the U.S. will release the October Producer Price Index (PPI). Following the October CPI once again exceeding expectations, the market will look to the PP
placeholder
Gold hit a one-year low while central banks bought 321 tonnes — the sellers were never the ones you thinkSpot gold closed at 3,876 on Thursday, down 2.8% and its lowest close in more than a year, with an intraday low near 3,852. The dollar is at a 19-month high of 103.21 and the 10-year yield is at 5.10%, so the price move is easy to explain. What is harder to explain is who sold: central banks bought 321 tonnes in Q3, the PBoC added for a 24th straight month, ETF holdings are near a record 4,256 tonnes, and roughly 95% of the futures selling came from non-reportable and sovereign-type accounts rather than hedge funds. This piece separates the two books that have to balance.
Author  Irene Q.
23 hours ago
Spot gold closed at 3,876 on Thursday, down 2.8% and its lowest close in more than a year, with an intraday low near 3,852. The dollar is at a 19-month high of 103.21 and the 10-year yield is at 5.10%, so the price move is easy to explain. What is harder to explain is who sold: central banks bought 321 tonnes in Q3, the PBoC added for a 24th straight month, ETF holdings are near a record 4,256 tonnes, and roughly 95% of the futures selling came from non-reportable and sovereign-type accounts rather than hedge funds. This piece separates the two books that have to balance.
placeholder
Brent rose 3.3% and US crude stocks built 4.66 million barrels in the same weekBrent January settled at 95.82, up 3.3%, and WTI at 88.74, up 2.55%, after the US signalled it would not pursue a deal with Iran and attacks on Gulf shipping continued. In the same week, EIA data showed US crude inventories rising 4.657 million barrels against expectations of a 1.1 million draw, with gasoline up another 1.799 million. OPEC output also rebounded 1.96 million barrels a day to 27.16 million in October, led by Saudi Arabia at 10.56 million. This piece separates the geopolitical premium from the physical balance and lays out where each side of the trade is anchored.
Author  Irene Q.
23 hours ago
Brent January settled at 95.82, up 3.3%, and WTI at 88.74, up 2.55%, after the US signalled it would not pursue a deal with Iran and attacks on Gulf shipping continued. In the same week, EIA data showed US crude inventories rising 4.657 million barrels against expectations of a 1.1 million draw, with gasoline up another 1.799 million. OPEC output also rebounded 1.96 million barrels a day to 27.16 million in October, led by Saudi Arabia at 10.56 million. This piece separates the geopolitical premium from the physical balance and lays out where each side of the trade is anchored.
goTop
quote