


Is a Stock Market Crash Coming? What History Says a $10,000 Investment in an S&P 500 ETF Could Be Worth at the End of 2027.
Key Points
Bear markets tend to be quick and painful, lasting less than a year.
However, there is good reason to believe a market crash is not imminent.
- 10 stocks we like better than S&P 500 Index ›
Investors have been increasingly worried that an artificial intelligence (AI) bubble is forming and that it could soon burst, sending stocks plummeting. In such a scenario, a $10,000 investment in an S&P 500 exchange-traded fund (ETF), such as the Vanguard S&P 500 ETF (NYSEMKT: VOO), could be much lower at the end of 2027.
Based on past bear markets, that could result in a 30% loss, and your $10,000 investment would be worth only around $7,000 at year-end 2027. However, that is not the only potential scenario, as we are entering what is also historically a strong period for stocks.
Missed AI’s "Act 1"? Act 2 Could Be 15x Bigger. Most investors think they missed the AI boat because they didn't buy Nvidia in 2005. But according to our analysts, we’re only at the end of "Act 1"—the R&D phase. "Act 2" is the global rollout. Continue »
Bear markets are typically steep and short
While the average bull market since 1942 has lasted over four years, the average bear market has lasted just over 11 months. Meanwhile, the average cumulative loss during these bear markets has been 31.7%, according to First Trust and Bloomberg data.
The current AI-driven market has been most often compared to the dot-com boom and subsequent crash. That bear market lasted about one and a half years and saw the S&P 500 (SNPINDEX: ^GSPC) fall nearly 37%. There are some key differences between these two markets, however.
One is that the S&P 500 today is actually much more heavily weighted toward the companies leading the AI boom. At the end of 1999, before the market burst, the S&P 500 was still very diversified, with Walmart, General Electric, ExxonMobil, Citigroup, and Home Depot among the index's top 10 largest holdings. Today, 40% of the S&P weighting is made up of tech stocks, and every one of its top 10 holdings is an AI stock. That could potentially mean a much harsher pullback than the S&P saw in 2000.
However, balancing that out is that, from a valuation perspective, tech stocks are trading at a much lower valuation today than before the dot-com crash. According to Reuters, the technology sector was valued as high as 48 times the next 12 months' earnings estimates during the dot-com boom. Today, the technology sector trades at a forward P/E of around 19 times. Thus, while the S&P 500 has more tech exposure, it's also starting from a less frothy position. In fact, the S&P 500's PEG ratio -- the trailing P/E ratio divided by the expected earnings growth rate -- is the lowest it's been in more than 30 years, at around 0.7, according to Yardeni Research. This is only the fifth time it's dropped below 1 since at least 1995, and well below its 1.3 average.
Another big difference between these two technological innovation periods is the companies doing the spending and the paybacks on these investments. The internet boom was mainly funded by large telecom and cable companies that were building out broadband networks. These were long-term assets, but with relatively slow payback periods.
The AI boom, meanwhile, is being fueled by megacap tech companies. Cloud computing companies are doing the bulk of the spending and generally see quick paybacks. However, the actual assets depreciate much more quickly with around a five- to six-year replacement cycle, creating a permanent AI spending treadmill. As long as end-user demand and token monetization outpace depreciation, the AI flywheel will continue. However, the risk is that if revenue growth starts to slow, the hardware refresh cycle does not, leading to a big squeeze in margins.
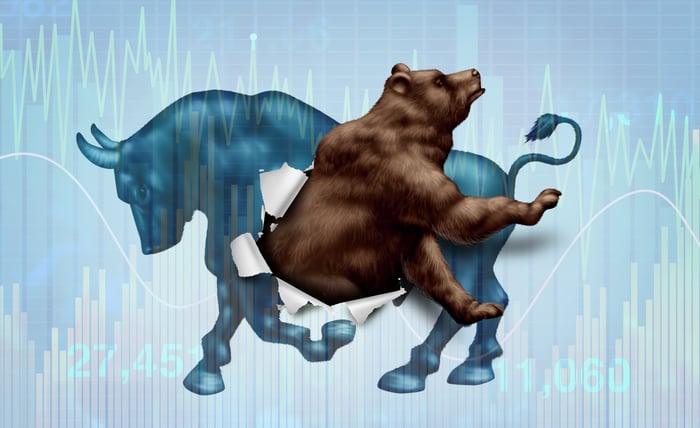
Image source: Getty Images
A different scenario
With AI spending looking set to continue to boom over at least the next few years, a market crash next year likely isn't in the cards, in my view. Meanwhile, the market is entering what is historically a very strong period for stocks.
Since 1938, the S&P 500 has risen 95% of the time over the next 12 months following midterm elections. Meanwhile, the index has generated a 14.5% average return from November to November of the following year since 1950. In this scenario, your $10,000 investment in an S&P 500 ETF would be worth nearly $11,500.
Ultimately, trying to predict where the market is headed and when a pullback may occur is a losing bet. While I think the bull market will continue, the best move is to continue to dollar-cost average into an ETF like the Vanguard S&P 500 ETF in both good markets and bad. This is what eventually helps you build long-term wealth.
Should you buy stock in S&P 500 Index right now?
Before you buy stock in S&P 500 Index, consider this:
The Motley Fool Stock Advisor analyst team just identified what they believe are the 10 best stocks for investors to buy now… and S&P 500 Index wasn’t one of them. The 10 stocks that made the cut could produce monster returns in the coming years.
Consider when Netflix made this list on December 17, 2004... if you invested $1,000 at the time of our recommendation, you’d have $355,124!* Or when Nvidia made this list on April 15, 2005... if you invested $1,000 at the time of our recommendation, you’d have $1,296,254!*
Now, it’s worth noting Stock Advisor’s total average return is 901% — a market-crushing outperformance compared to 210% for the S&P 500. Don't miss the latest top 10 list, available with Stock Advisor, and join an investing community built by individual investors for individual investors.
See the 10 stocks »
*Stock Advisor returns as of October 27, 2026.
Geoffrey Seiler has positions in Vanguard S&P 500 ETF. The Motley Fool has positions in and recommends Vanguard S&P 500 ETF. The Motley Fool has a disclosure policy.
Recommended Articles


