

Dogecoin Price Forecast: Extended correction and weakening momentum raise downside risks

Source Fxstreet
  • Dogecoin extends its correction, falling more than 5% and trading around $0.090 mid-week.
  • Rising short positions and signs of overheated conditions among traders increase the risk of further downside in DOGE.
  • The technical outlook shows weakening momentum, hinting at a deeper correction.

Dogecoin (DOGE) extends its losses, trading around $0.090 on Wednesday, down more than 5% so far this week. Bearish pressure is strengthening, with short positions reaching a one-month high and traders in overheated conditions. Meanwhile, weakening momentum indicators are also hinting at further losses in DOGE.

Dogecoin key metrics show bearish signs

Derivatives data shows cautious signals among traders. CoinGlass’ long-to-short ratio for Dogecoin reads 0.68 on Wednesday, the lowest level over a month. A ratio being below one indicates bearish sentiment, as traders bet that asset prices will fall.
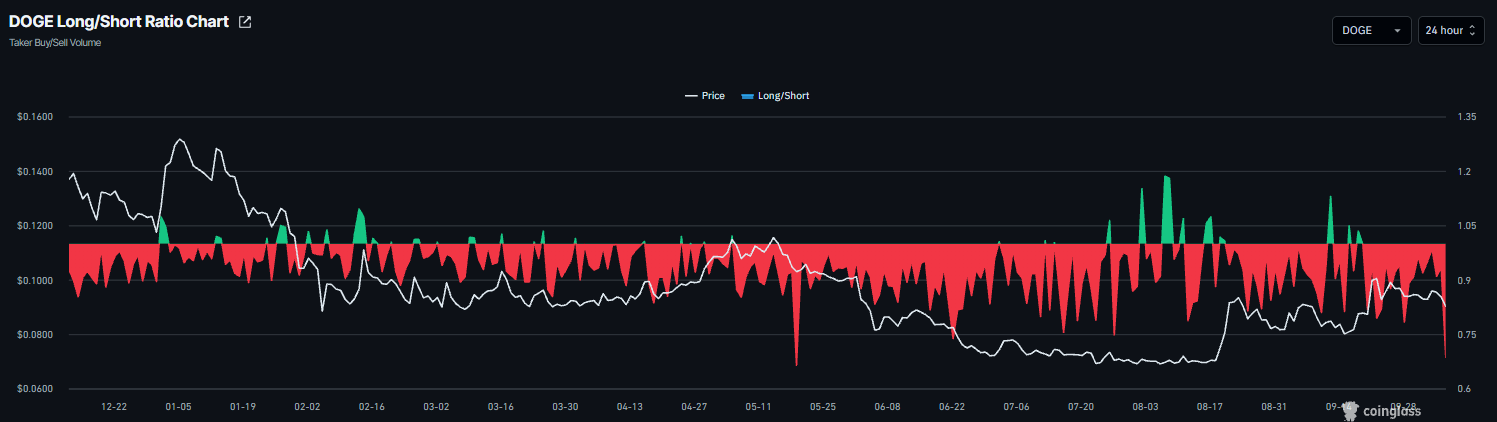
Dogecoin long-to-short ratio chart. Source: Coinglass

CryptoQuant’s summary data also shows a bearish outlook for the dog-themed meme coin. DOGE’s spot and futures markets show overheating conditions, while the futures market shows large whale orders but with sell-side dominance. These highlight a bearish, cautious sentiment bias among Dogecoin traders.
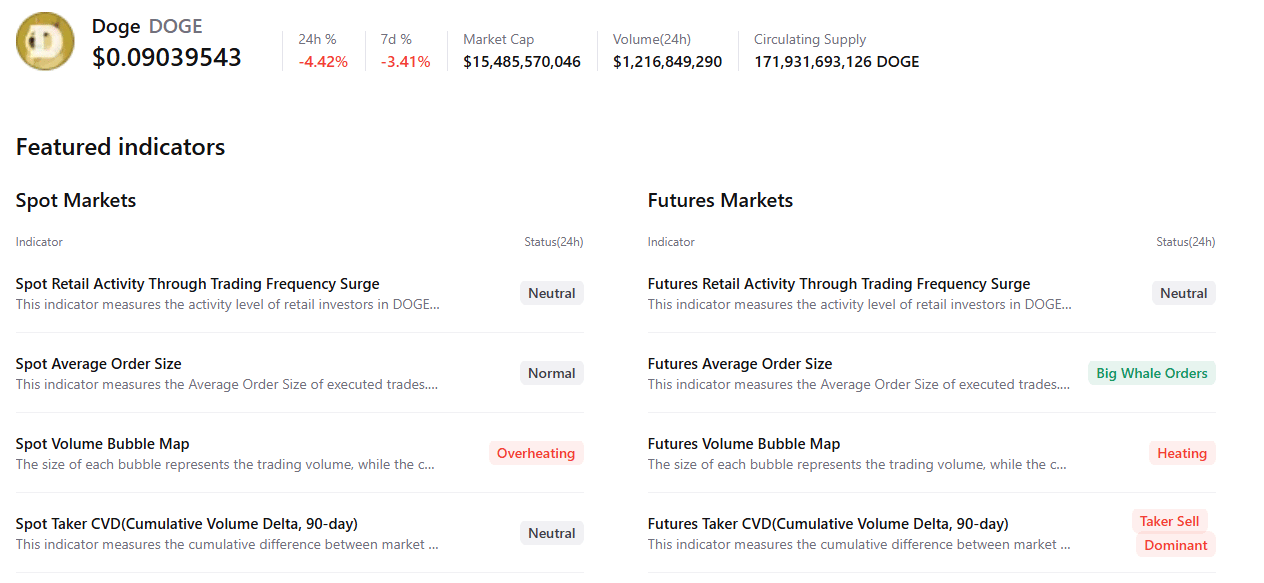
DOGE summary chart. Source: CryptoQuant

Dogecoin technical outlook: DOGE slips below key 200-day EMA

Dogecoin price trades at $0.090 on Wednesday, down over 5% so far this week. Despite the correction, DOGE remains mildly bearish in the near term, capped below the 200-day Exponential Moving Average (EMA) at $0.093. Price holds above the 50-day EMA at $0.088 and the 100-day EMA at $0.086, suggesting underlying demand still supports the broader uptrend structure, but the Relative Strength Index (RSI) near 48 and a slightly negative Moving Average Convergence Divergence (MACD) line hint at fading momentum while the pair consolidates under the recent highs.

On the downside, immediate support clusters around $0.088, where the 50-day EMA coincides with a horizontal level, followed by the 100-day EMA at $0.086 and the former trendline break area near $0.085; a daily close below this zone would open the way to the deeper horizontal floor at $0.070.

On the topside, DOGE would need to reclaim the 200-day EMA at $0.093 to ease bearish pressure, with the next notable resistance coming at the horizontal barrier around $0.102, where sellers are likely to re-emerge.
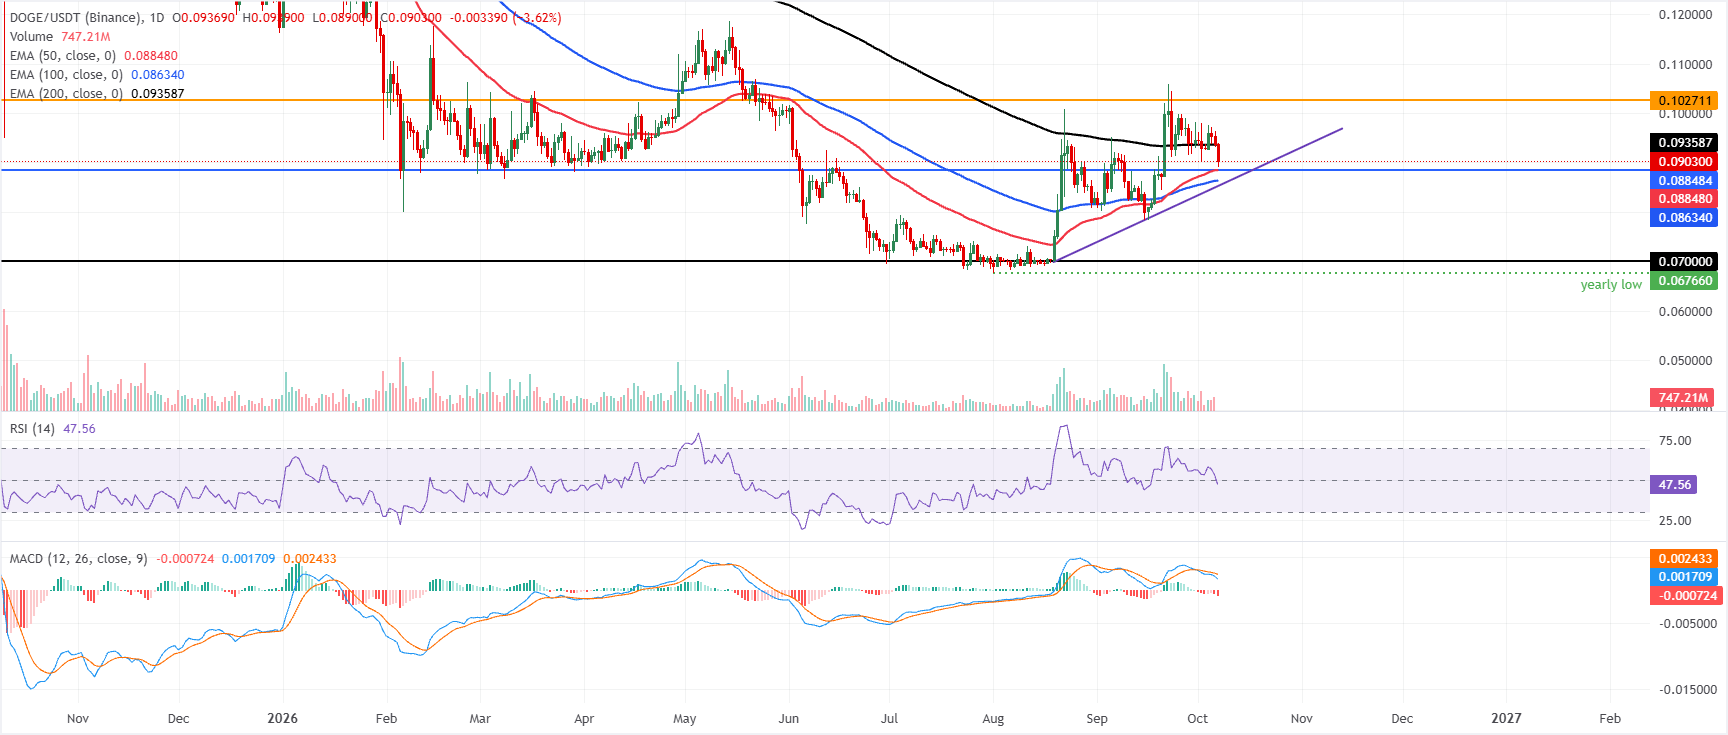
DOGE/USDT daily chart

(The technical analysis of this story was written with the help of an AI tool. Know more.)

Disclaimer: For information purposes only. Past performance is not indicative of future results.
placeholder
October hike odds climb toward 60% as Goldman and BofA both flip — what Warsh's "dose of accommodation" really changedRate futures now price roughly 55% to 62% for a 25bp hike at the October 27-28 FOMC, up from about 30% before Chair Warsh's post-meeting framing that the Fed is merely "removing some accommodation." Goldman Sachs has added an October hike to its forecast and Bank of America now sees moves in both October and December. Here is the repricing, the language behind it, and the two data points that decide it.
Author  Irene Q.
Sep 23, Wed
Rate futures now price roughly 55% to 62% for a 25bp hike at the October 27-28 FOMC, up from about 30% before Chair Warsh's post-meeting framing that the Fed is merely "removing some accommodation." Goldman Sachs has added an October hike to its forecast and Bank of America now sees moves in both October and December. Here is the repricing, the language behind it, and the two data points that decide it.
placeholder
Gold holds steady below $4,150 amid elevated US yields Gold price (XAU/USD) trades on a flat note near $4,140 during the early Asian session on Tuesday. Pressure from a stronger US Dollar (USD) and elevated US Treasury yields was offset by reduced expectations of a Federal Reserve (Fed) rate hike this month.
Author  FXStreet
Yesterday 01: 14
Gold price (XAU/USD) trades on a flat note near $4,140 during the early Asian session on Tuesday. Pressure from a stronger US Dollar (USD) and elevated US Treasury yields was offset by reduced expectations of a Federal Reserve (Fed) rate hike this month.
placeholder
Japanese Yen drifts lower as sustained USD buying offsets intervention fearsThe USD/JPY pair attracts some buyers following the previous day's two-day price moves, trading above the 158.00 mark during the early part of the European session on Tuesday.
Author  FXStreet
22 hours ago
The USD/JPY pair attracts some buyers following the previous day's two-day price moves, trading above the 158.00 mark during the early part of the European session on Tuesday.
placeholder
AUD/USD Price Forecast: Struggles to return to 0.7000 amid firm US DollarThe Australian Dollar (AUD) gives back its early gains after rising to near 0.6975 and turns marginally lower at around 0.6964 against the US Dollar (USD) during the European trading session on Tuesday.
Author  FXStreet
21 hours ago
The Australian Dollar (AUD) gives back its early gains after rising to near 0.6975 and turns marginally lower at around 0.6964 against the US Dollar (USD) during the European trading session on Tuesday.
placeholder
WTI rises to near $89.50 as Middle East supply threats offset Persian Gulf recoveryWest Texas Intermediate (WTI) oil price extends its gains for the second successive day, trading around $89.50 per barrel during the Asian hours on Wednesday. Crude oil climbed as persistent risks to Middle East energy flows overshadowed signs of rising supply from the region.
Author  FXStreet
5 hours ago
West Texas Intermediate (WTI) oil price extends its gains for the second successive day, trading around $89.50 per barrel during the Asian hours on Wednesday. Crude oil climbed as persistent risks to Middle East energy flows overshadowed signs of rising supply from the region.
Related Instrument
goTop
quote