


Dow Jones Industrial Average rises on earnings, cheaper Crude Oil
- DJIA hits its highest in more than five weeks and ends near 52,500.
- UnitedHealth, Amazon, IBM and 3M add the most points as Treasury yields fall.
- IBM reports Wednesday, with Honeywell and Procter & Gamble due Thursday.
Artificial intelligence (AI) stocks pulled the NASDAQ 100 lower, but the Dow Jones Industrial Average rose to its highest in more than five weeks on earnings and cheaper Crude Oil. It climbed from the opening bell to just above 52,700. It fell to about 52,400 in one five-minute bar when a diplomat in the US-Iran talks called reports of a close deal wrong, and it ended just under 52,500.
Health care led the S&P 500's sectors, and UnitedHealth (UNH), Amazon (AMZN), IBM (IBM) and 3M (MMM) added the most points to the price-weighted Dow. 3M raised its 2026 profit forecast to $9.10-$9.15 a share and issued Amazon a warrant for up to 3.2 million shares tied to $6 billion of data centre sales. UnitedHealth, which reported on October 13, added about three times as many points as 3M.
Crude Oil fell and the 10-year Treasury yield fell with it, a week after higher yields and worries over AI debt gave US stocks their worst week since June. Korean AI firm Elice fell more than 30% in its Seoul debut. Nvidia (NVDA) and Microsoft (MSFT) both rose anyway, so the AI selling took little off the Dow.
On the calendar
IBM reports on Wednesday with a call at 21:00 GMT, and Honeywell (HON) and Procter & Gamble (PG) report before the opening bell on Thursday, with calls at 12:30 GMT. American Express (AXP) follows before the opening bell on Friday, the fourth Dow member to report in three days.
Initial jobless claims are due on Thursday at 12:30 GMT, forecast at 200K after 199K. The flash Purchasing Managers Index (PMI) surveys from S&P Global come out on Friday at 13:45 GMT, with services forecast at 57.9 after 58.8. Both feed the Fed's October 28 decision on whether to raise rates again.
On the charts
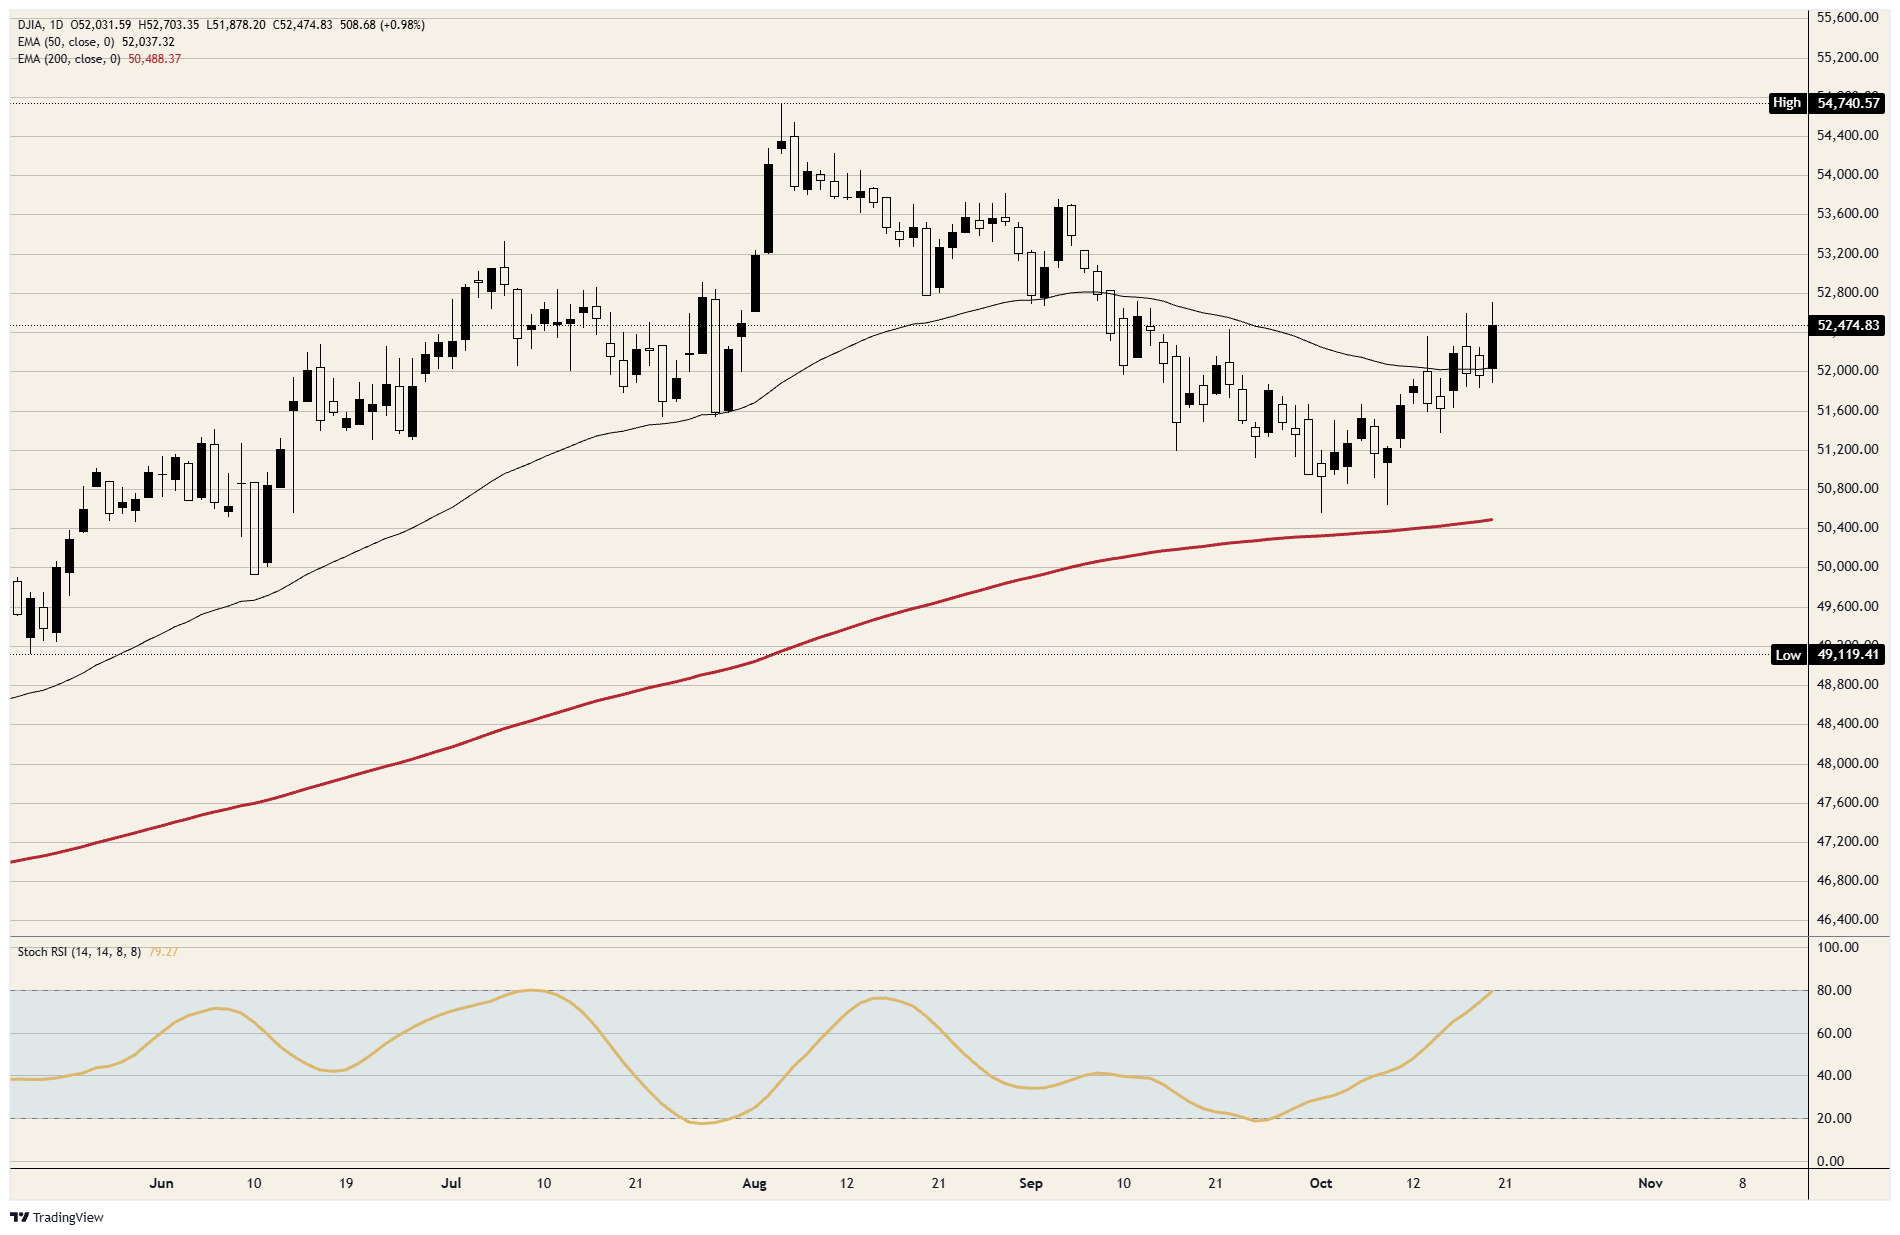
The Dow ended back over its 50-day Exponential Moving Average (EMA), now near 52,000, after dipping under it on Friday and Monday. It has won back nearly half of its drop from the August peak just above 54,700 to the October 1 low, which held just above the 200-day EMA near 50,500. Daily momentum is at the edge of overbought for the first time since early July.
DJIA daily chart
Dow Jones FAQs
The Dow Jones Industrial Average, one of the oldest stock market indices in the world, is compiled of the 30 most traded stocks in the US. The index is price-weighted rather than weighted by capitalization. It is calculated by summing the prices of the constituent stocks and dividing them by a factor, currently 0.152. The index was founded by Charles Dow, who also founded the Wall Street Journal. In later years it has been criticized for not being broadly representative enough because it only tracks 30 conglomerates, unlike broader indices such as the S&P 500.
Many different factors drive the Dow Jones Industrial Average (DJIA). The aggregate performance of the component companies revealed in quarterly company earnings reports is the main one. US and global macroeconomic data also contributes as it impacts on investor sentiment. The level of interest rates, set by the Federal Reserve (Fed), also influences the DJIA as it affects the cost of credit, on which many corporations are heavily reliant. Therefore, inflation can be a major driver as well as other metrics which impact the Fed decisions.
Dow Theory is a method for identifying the primary trend of the stock market developed by Charles Dow. A key step is to compare the direction of the Dow Jones Industrial Average (DJIA) and the Dow Jones Transportation Average (DJTA) and only follow trends where both are moving in the same direction. Volume is a confirmatory criteria. The theory uses elements of peak and trough analysis. Dow’s theory posits three trend phases: accumulation, when smart money starts buying or selling; public participation, when the wider public joins in; and distribution, when the smart money exits.
There are a number of ways to trade the DJIA. One is to use ETFs which allow investors to trade the DJIA as a single security, rather than having to buy shares in all 30 constituent companies. A leading example is the SPDR Dow Jones Industrial Average ETF (DIA). DJIA futures contracts enable traders to speculate on the future value of the index and Options provide the right, but not the obligation, to buy or sell the index at a predetermined price in the future. Mutual funds enable investors to buy a share of a diversified portfolio of DJIA stocks thus providing exposure to the overall index.
Recommended Articles


