


Bitcoin Price Forecast: ETF outflows hit $1.07 billion as BTC struggles to recover from oversold levels
- Bitcoin trades below $65,200 on Monday after hitting a low of $62,006 last week and marking its sixth straight weekly loss.
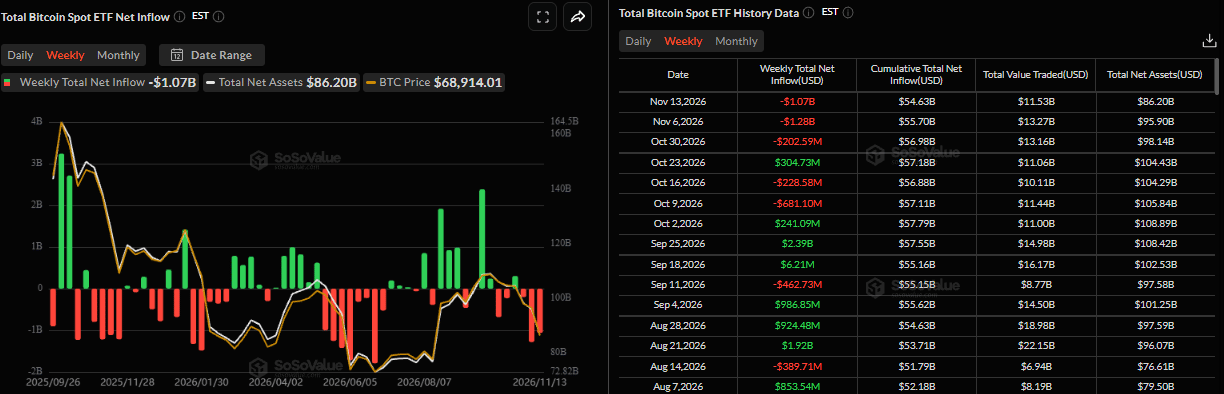
- US-listed spot ETFs recorded an outflow of $1.07 billion last week, marking the second consecutive week of billion-dollar withdrawals.
- Oversold conditions raise the possibility of a short-term relief bounce, but continued selling by large holders and bearish trend signals leave a sustained recovery uncertain.
Bitcoin (BTC) struggles to regain ground, trading below $65,200 on Monday after extending its decline to a low of $62,006 last week, levels not seen since mid-July. Persistent institutional selling is adding pressure, with spot BTC Exchange Traded Funds (ETFs) recording their second straight week of billion-dollar outflows.
Traders should be cautious as, following its sixth straight weekly loss, BTC has reached oversold conditions, raising the possibility of a short-term relief bounce, but continued selling by large holders and bearish trend signals leave the Crypto King’s recovery uncertain.
Consecutive billion-dollar ETF outflows
Institutional demand for Bitcoin weakened last week. SoSoValue data shows BTC spot ETFs recorded net outflows of $1.07 billion last week, following $1.28 billion in net withdrawals the previous week. Moreover, last week’s outflow marked the third straight week of withdrawals, indicating weakening investor demand. If this outflow trend continues and intensifies throughout this week, it could put additional pressure on BTC, pushing its price into further correction.
Bitcoin faces uncertain recovery as oversold signals clash with continued whale selling
According to a 10x Research report, the weekend sell-off cleared out almost every leveraged position opened since the August rally, pushing market breadth, sentiment and momentum indicators to some of their weakest levels in years.
The report further explained that the stretched conditions increase the possibility of a short-term relief bounce, but a sustained recovery remains uncertain as large holders continue to sell and trend-following models have yet to signal a reversal.
“Taken together, the pieces fit. This is not the time to buy, and it is not the time to give up either. It’s time to plan, set the levels where we would buy, and get ready for the next move,” added the analyst.
Bitcoin technical outlook: Sellers tighten their grip despite overextended downside
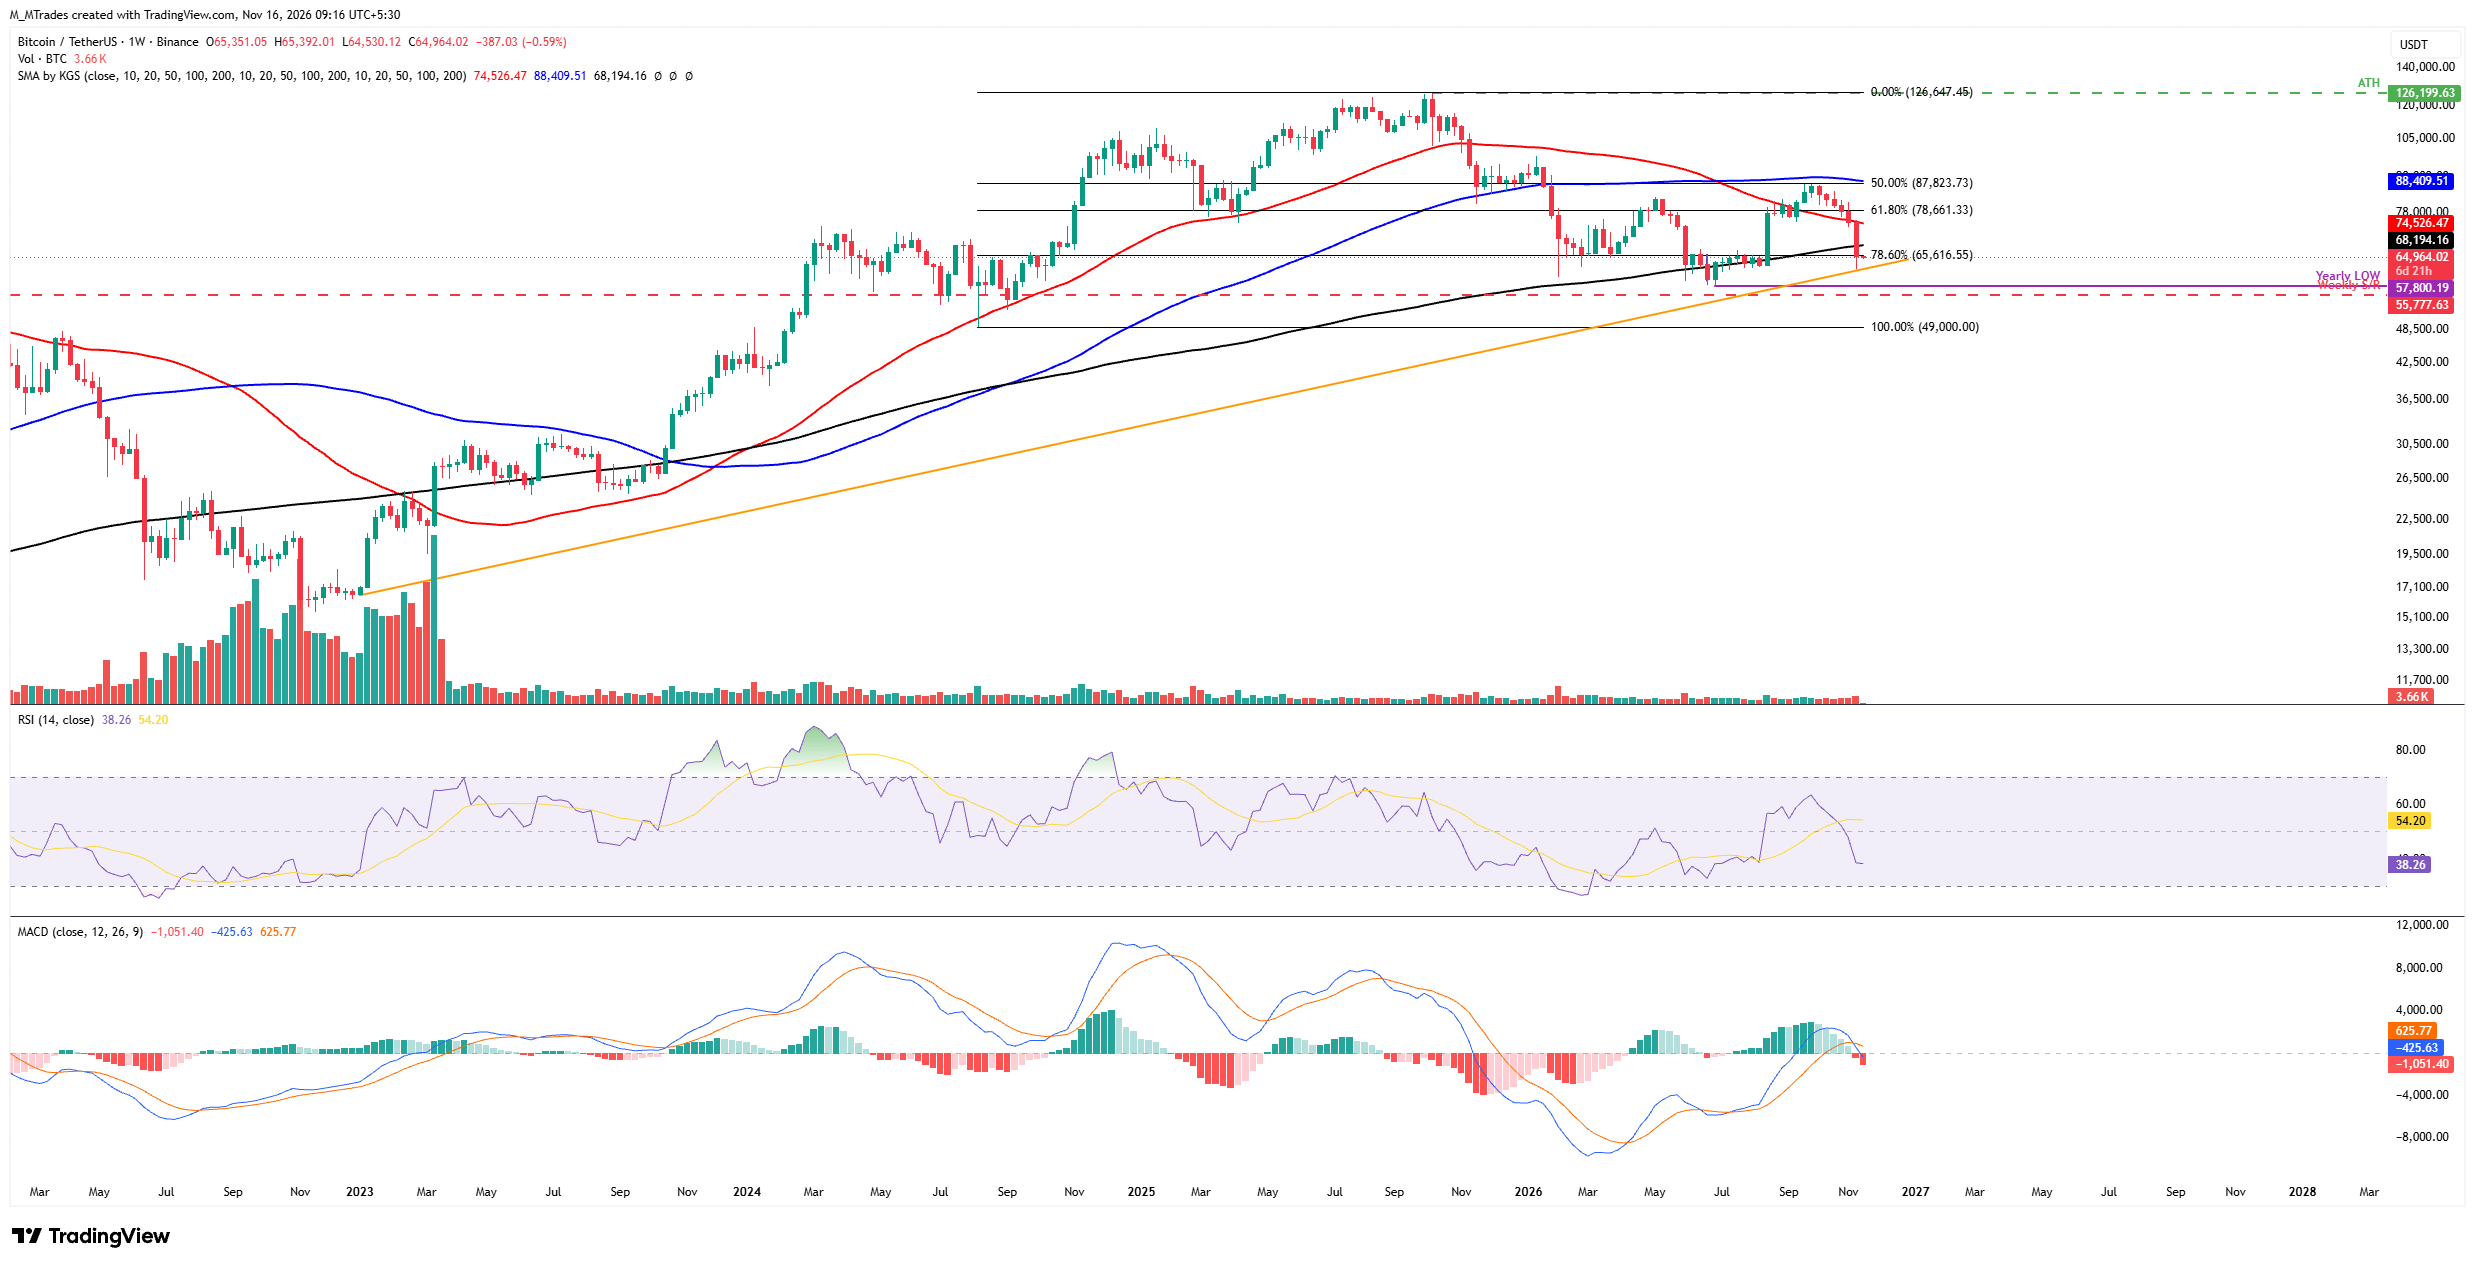
The Crypto King has been correcting since early October, posting six consecutive weeks of losses that add up to a decline of over 24%. It closed below the key 200-week Simple Moving Average (SMA) at $68,194 and the 78.6% Fibonacci retracement level of $65,616 (drawn from the August 2024 low of $49,000 to the October 2025 record high of $126,199) last week. As of this week, BTC is extending losses, trading around $64,964 on Monday.
If BTC continues its correction, it could signal a deeper move toward the key psychological level at $60,000.
The Relative Strength Index (RSI) on the weekly chart stands at 38, below the neutral 50 level, suggesting strong bearish momentum. Meanwhile, the Moving Average Convergence Divergence (MACD) histogram showed a bearish crossover last week, which remains intact, further supporting the bearish thesis.
On the other hand, if BTC recovers, it could extend the advance toward the 200-week SMA at $68,194.
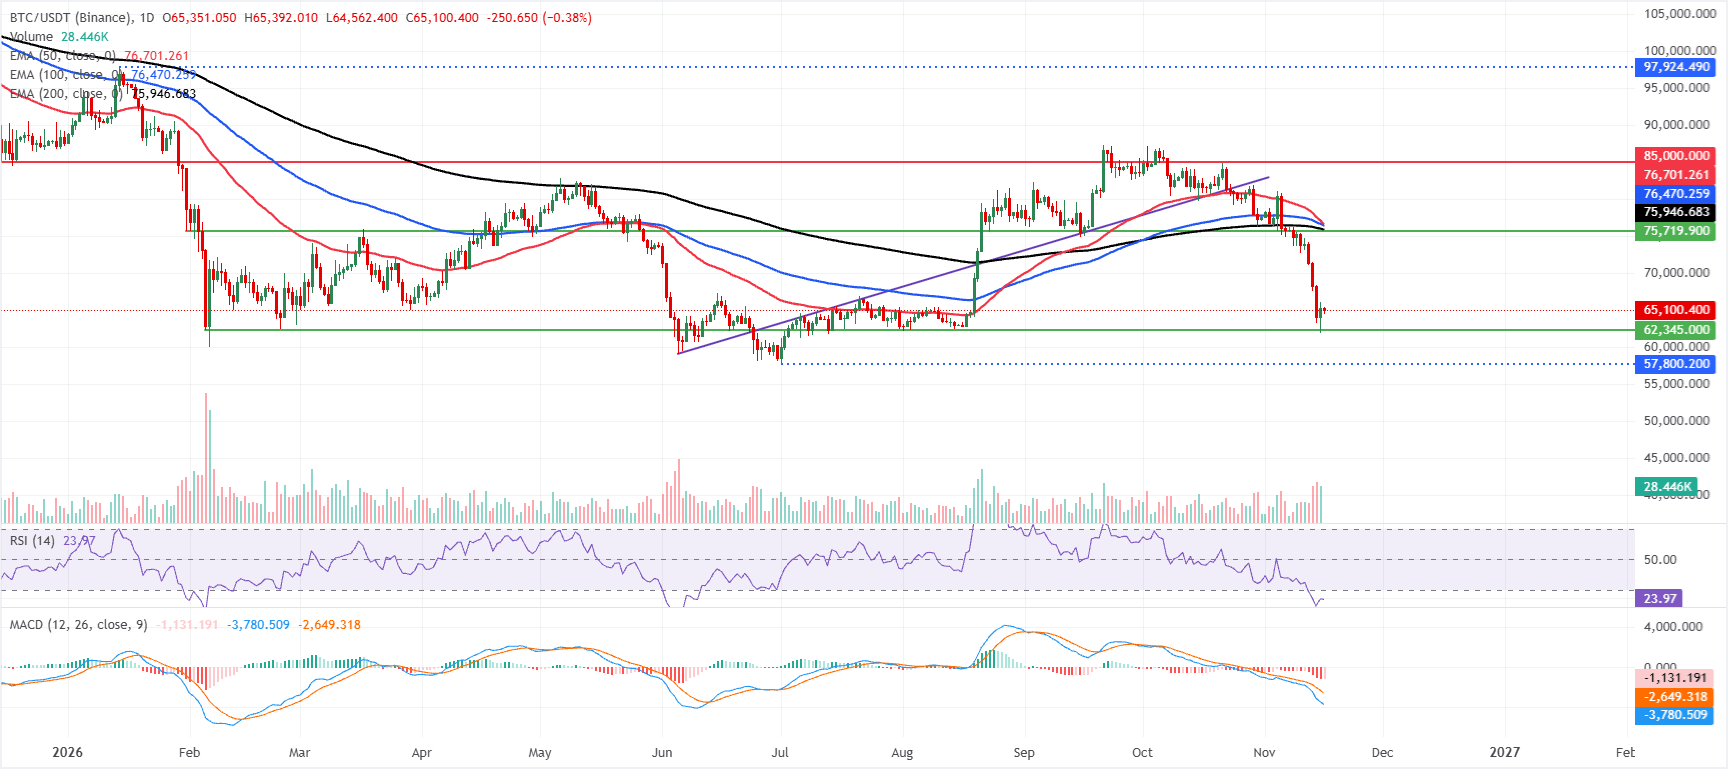
On the daily chart, the Crypto King is extending its retreat well below key Exponential Moving Averages (EMAs), keeping the near‑term bias firmly bearish. The 200-day EMA caps price around $75,946, with the 100-day EMA at $76,470 and the 50-day EMA at $76,701 reinforcing a dense overhead supply zone.
The daily RSI sits in oversold territory near 23, suggesting downside momentum is stretched. At the same time, the MACD remains deeply negative, indicating bearish pressure still dominates despite the risk of a short‑term bounce.
On the topside, initial resistance is seen at the 200‑day EMA near $75,946, followed by the 100‑day EMA at $76,470 and the 50‑day EMA at $76,701, which together form a broad resistance cluster ahead of the horizontal barrier at $85,000.
On the downside, with no nearby structural demand levels on the price chart, traders will likely rely on momentum cues, as the oversold RSI and weak MACD readings suggest that while the broader trend remains under pressure, any recovery attempt would first need to challenge the stacked EMAs overhead to improve the technical outlook.
(The technical analysis of this story was written with the help of an AI tool. Know more.)
Bitcoin, altcoins, stablecoins FAQs
Bitcoin is the largest cryptocurrency by market capitalization, a virtual currency designed to serve as money. This form of payment cannot be controlled by any one person, group, or entity, which eliminates the need for third-party participation during financial transactions.
Altcoins are any cryptocurrency apart from Bitcoin, but some also regard Ethereum as a non-altcoin because it is from these two cryptocurrencies that forking happens. If this is true, then Litecoin is the first altcoin, forked from the Bitcoin protocol and, therefore, an “improved” version of it.
Stablecoins are cryptocurrencies designed to have a stable price, with their value backed by a reserve of the asset it represents. To achieve this, the value of any one stablecoin is pegged to a commodity or financial instrument, such as the US Dollar (USD), with its supply regulated by an algorithm or demand. The main goal of stablecoins is to provide an on/off-ramp for investors willing to trade and invest in cryptocurrencies. Stablecoins also allow investors to store value since cryptocurrencies, in general, are subject to volatility.
Bitcoin dominance is the ratio of Bitcoin's market capitalization to the total market capitalization of all cryptocurrencies combined. It provides a clear picture of Bitcoin’s interest among investors. A high BTC dominance typically happens before and during a bull run, in which investors resort to investing in relatively stable and high market capitalization cryptocurrency like Bitcoin. A drop in BTC dominance usually means that investors are moving their capital and/or profits to altcoins in a quest for higher returns, which usually triggers an explosion of altcoin rallies.
Recommended Articles


