

Ethereum Plunges 15% in a Week as Record Staking Rate Fails to Hold $2,000 Mark

Source Tradingkey

TradingKey - Ethereum's staking ratio has surged to an all-time high, yet its price has plunged 15% over the past seven days, putting the key $2,000 psychological threshold at risk.

On November 12, Ethereum (ETH) trended lower amid volatility, falling more than 1% to approach the $2,000 mark. Amid a wave of severe deleveraging across the crypto market in early November 2026, the price of ETH plunged approximately 15% in just one week, dropping sharply from around $2,446 to $2,045.

Although on-chain data shows that the ETH staking ratio has bucked the trend to hit an all-time high, demonstrating strong lock-up confidence among long-term holders and validator nodes, the key $2,000 psychological threshold faces a severe risk of being breached under the dual pressures of tightening macroeconomic liquidity and persistent net outflows from institutional spot ETFs.

According to data from Token Terminal, Ethereum's network-wide staking ratio has broken all-time records, reaching 36.32% of total circulating supply, up 4.32 percentage points against the trend since May this year. While this has reduced spot selling pressure on exchanges, buy-side liquidity in the secondary market remains extremely thin.

As Layer 2 data compression efficiency has improved significantly, gas fees paid to the Ethereum mainnet have declined, leading to a sharp drop in the amount of ETH burned via EIP-1559 and weakening the market's valuation premium for its deflationary narrative. Consequently, even with more than a third of the supply locked in staking contracts, contracting supply alone has struggled to boost token prices.

In addition, U.S. October headline and core CPI both exceeded expectations, and several Federal Reserve officials stated that they could not rule out resuming rate hikes in December. Bitcoin decisively lost its strong support level at $75,000, dragging ETH lower. Furthermore, dominated by risk-off sentiment, existing market capital fled back into Bitcoin for safe-haven protection, making Ethereum one of the hardest-hit major assets in this market correction.

Currently, the ETH price is testing the $2,000 defense line. Ahead of the upcoming release of U.S. PPI data and the Federal Reserve meeting minutes, Bitcoin is highly likely to continue trending lower to test the $70,000 mark, significantly raising the probability of ETH briefly spiking below $2,000 in the short term. If it decisively breaks below that level, ETH will open up downside room and could fall further to retest $1,500.
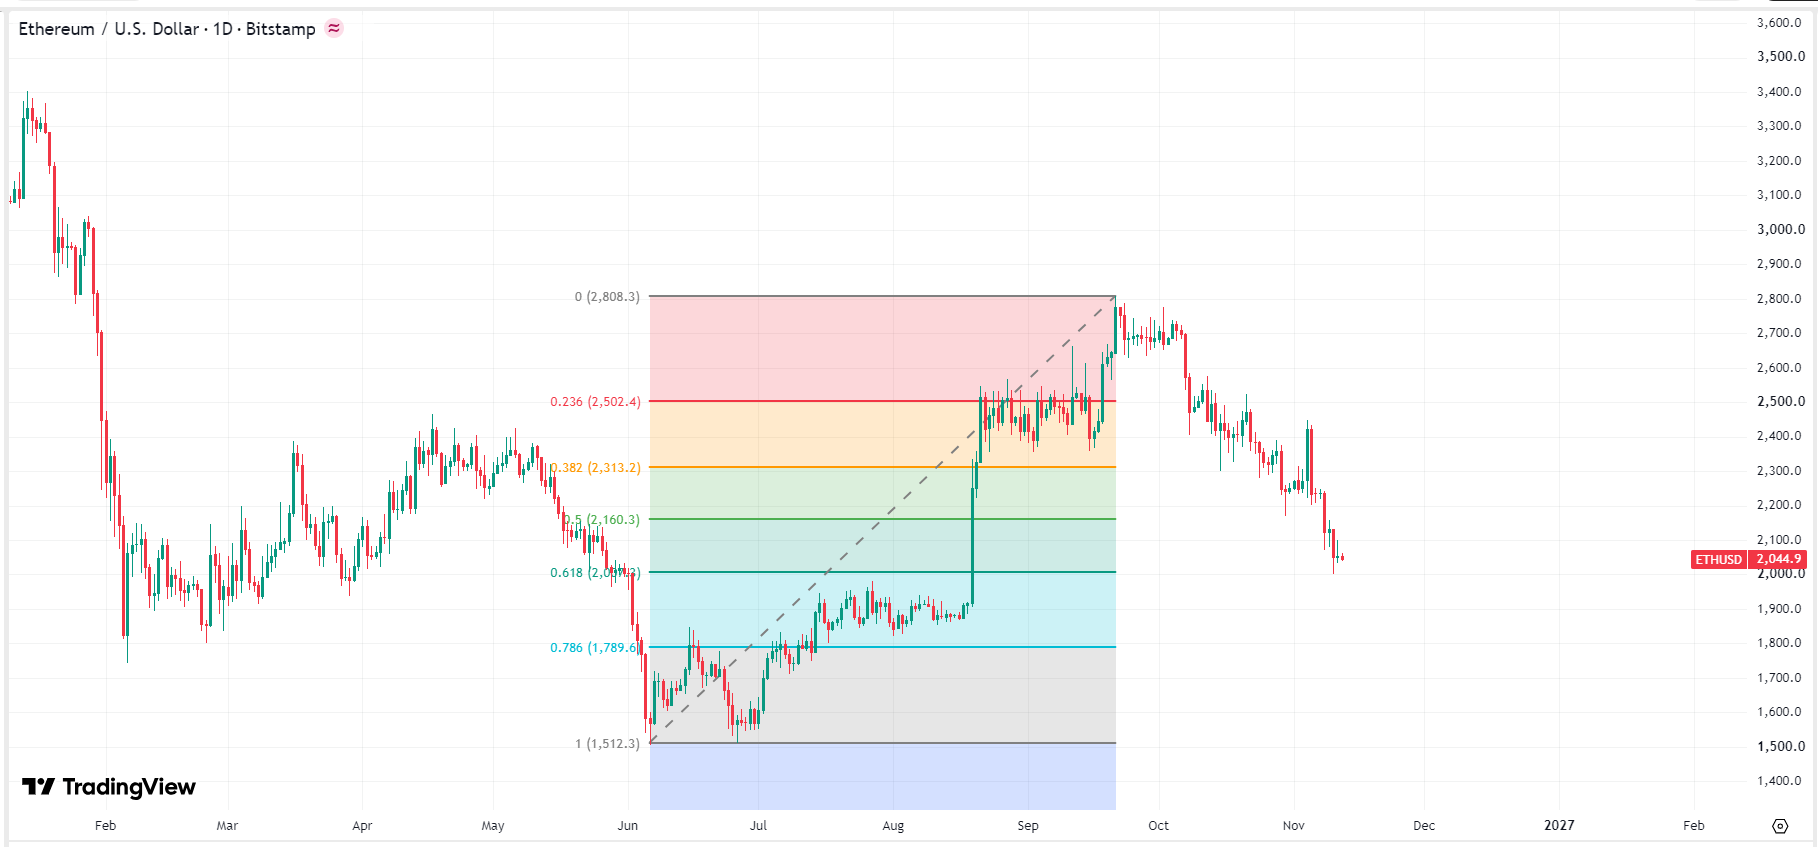
ethereum-eth-usd-price-a0eea5bb74454bfaa6cc63512bed629eETH Price Chart, Source: TradingView

Disclaimer: For information purposes only. Past performance is not indicative of future results.
placeholder
Gold Price Analysis Today | Forex Gold Analysis | XAU/USD Analysis - November 11, 2026Get the latest gold price analysis, forex gold insights, and XAU/USD analysis for November 11, 2026. Read on for the details.
Author  Mitrade
Nov 11, Wed
Get the latest gold price analysis, forex gold insights, and XAU/USD analysis for November 11, 2026. Read on for the details.
placeholder
Nvidia slid 7.7% after hours while AMD and Broadcom rose — the AI trade changed hands, it didn't breakNvidia closed Wednesday at 173.73, up 2.87%, then fell as much as 8.1% to 159.44 after reports that its board was preparing for a possible leadership change. The same session, the Philadelphia Semiconductor Index rose 5.7% with all 30 components higher, CoreWeave jumped 24.7% on 168% revenue growth, and Micron added 11.9%. If AI demand were being repriced, AMD and Broadcom would not be bid. This is a governance discount on one name, and 204.54 — the 200-day average — is the level that settles it.
Author  Irene Q.
Nov 12, Thu
Nvidia closed Wednesday at 173.73, up 2.87%, then fell as much as 8.1% to 159.44 after reports that its board was preparing for a possible leadership change. The same session, the Philadelphia Semiconductor Index rose 5.7% with all 30 components higher, CoreWeave jumped 24.7% on 168% revenue growth, and Micron added 11.9%. If AI demand were being repriced, AMD and Broadcom would not be bid. This is a governance discount on one name, and 204.54 — the 200-day average — is the level that settles it.
placeholder
US October PPI Preview: Fed Rate Hike Expectations Rise, PPI May Be Key Variable; How Will US Stocks, Dollar, and Gold Move?On Friday (Nov. 13) Eastern Time, the U.S. will release the October Producer Price Index (PPI). Following the October CPI once again exceeding expectations, the market will look to the PP
Author  TradingKey
Nov 12, Thu
On Friday (Nov. 13) Eastern Time, the U.S. will release the October Producer Price Index (PPI). Following the October CPI once again exceeding expectations, the market will look to the PP
placeholder
Gold hit a one-year low while central banks bought 321 tonnes — the sellers were never the ones you thinkSpot gold closed at 3,876 on Thursday, down 2.8% and its lowest close in more than a year, with an intraday low near 3,852. The dollar is at a 19-month high of 103.21 and the 10-year yield is at 5.10%, so the price move is easy to explain. What is harder to explain is who sold: central banks bought 321 tonnes in Q3, the PBoC added for a 24th straight month, ETF holdings are near a record 4,256 tonnes, and roughly 95% of the futures selling came from non-reportable and sovereign-type accounts rather than hedge funds. This piece separates the two books that have to balance.
Author  Irene Q.
Yesterday 02: 40
Spot gold closed at 3,876 on Thursday, down 2.8% and its lowest close in more than a year, with an intraday low near 3,852. The dollar is at a 19-month high of 103.21 and the 10-year yield is at 5.10%, so the price move is easy to explain. What is harder to explain is who sold: central banks bought 321 tonnes in Q3, the PBoC added for a 24th straight month, ETF holdings are near a record 4,256 tonnes, and roughly 95% of the futures selling came from non-reportable and sovereign-type accounts rather than hedge funds. This piece separates the two books that have to balance.
placeholder
Brent rose 3.3% and US crude stocks built 4.66 million barrels in the same weekBrent January settled at 95.82, up 3.3%, and WTI at 88.74, up 2.55%, after the US signalled it would not pursue a deal with Iran and attacks on Gulf shipping continued. In the same week, EIA data showed US crude inventories rising 4.657 million barrels against expectations of a 1.1 million draw, with gasoline up another 1.799 million. OPEC output also rebounded 1.96 million barrels a day to 27.16 million in October, led by Saudi Arabia at 10.56 million. This piece separates the geopolitical premium from the physical balance and lays out where each side of the trade is anchored.
Author  Irene Q.
Yesterday 03: 06
Brent January settled at 95.82, up 3.3%, and WTI at 88.74, up 2.55%, after the US signalled it would not pursue a deal with Iran and attacks on Gulf shipping continued. In the same week, EIA data showed US crude inventories rising 4.657 million barrels against expectations of a 1.1 million draw, with gasoline up another 1.799 million. OPEC output also rebounded 1.96 million barrels a day to 27.16 million in October, led by Saudi Arabia at 10.56 million. This piece separates the geopolitical premium from the physical balance and lays out where each side of the trade is anchored.
goTop
quote