

Meme Coins Price Prediction: Dogecoin, Shiba Inu, and Pepe have yet to find a floor

Source Fxstreet
  • Dogecoin hovers around $0.0675 on Thursday, extending losses for the seventh consecutive week and hitting a three-year low.
  • Shiba Inu hovers above a crucial horizontal support level as downside momentum moderates.
  • Pepe takes a breather after a 16% decline the previous day, bringing a rising support trendline into focus.

Meme coins, including Dogecoin (DOGE), Shiba Inu (SHIB), and Pepe (PEPE), continue to attract sellers as the broader cryptocurrency market maintains a risk-off sentiment. Bitcoin (BTC) slipped below $75,000 this week amid hot US inflation reports, adding to last week’s uncertainty over tighter regulation as Democrats won the midterms.

Historically, slips in Bitcoin during bear market cycles often lead to sharper pullbacks in Dogecoin and other meme coins. However, PEPE shows long-term resilience, with a Year-to-Date (YTD) decline of just 7%, while DOGE and SHIB are down over 40%. 

Still, with macroeconomic concerns looming over Bitcoin, the meme coins remain vulnerable to deeper losses. The technical outlook for DOGE, SHIB, and PEPE highlights key support areas in focus, as sellers tighten their grip.

Dogecoin technical outlook: Falling-knife move warns of further downside potential

Dogecoin extends its decline for the seventh straight week to a three-year low, maintaining a clear bearish tone. The meme coin sits well below both the 50-day and 200-day Exponential Moving Averages (EMAs) at $0.0785 and $0.0885, respectively.

Momentum indicators show a downside bias, with the Moving Average Convergence Divergence (MACD) remaining below zero, while the Relative Strength Index (RSI) hovers near 30, hinting at persistent downside pressure and early signs of approaching oversold conditions.

The Fibonacci retracement of mid-September's upswing from $0.0784 to $0.1058 shows the price approaching the 161.8% extension level at $0.0651, which serves as the immediate support. A confirmed breakout below this zone could target the 200% level at $0.0580, hinting at more than 10% downside risk.

Chart Analysis DOGE/USDT (Binance)
DOGE/USDT daily price chart.

On the topside, initial resistance is clustered around the 100% Fibonacci retracement at $0.0784 and the 50-day EMA at $0.0785, with a higher barrier at the 200-day EMA at $0.0885.

Shiba Inu technical outlook: Bears threaten a key support level

Shiba Inu hovers around $0.00000436 on Thursday, stabilizing after a 2% decline the previous day. The meme coin has maintained a steady downward trend over the past six weeks, with a total decline of over 25%.

Momentum on the daily chart shows stabilizing downside pressure as the MACD and signal line converge in negative territory, with a declining, waning negative profile, while the RSI at 34 continues to move sideways just above the oversold territory.

The Fibonacci retracement over mid-September's upswing from $0.00000474 to $0.00000627 highlights the 127.2% Fibonacci retracement at $0.00000432 as the immediate support, guarding the 161.8% extension level at $0.00000379.
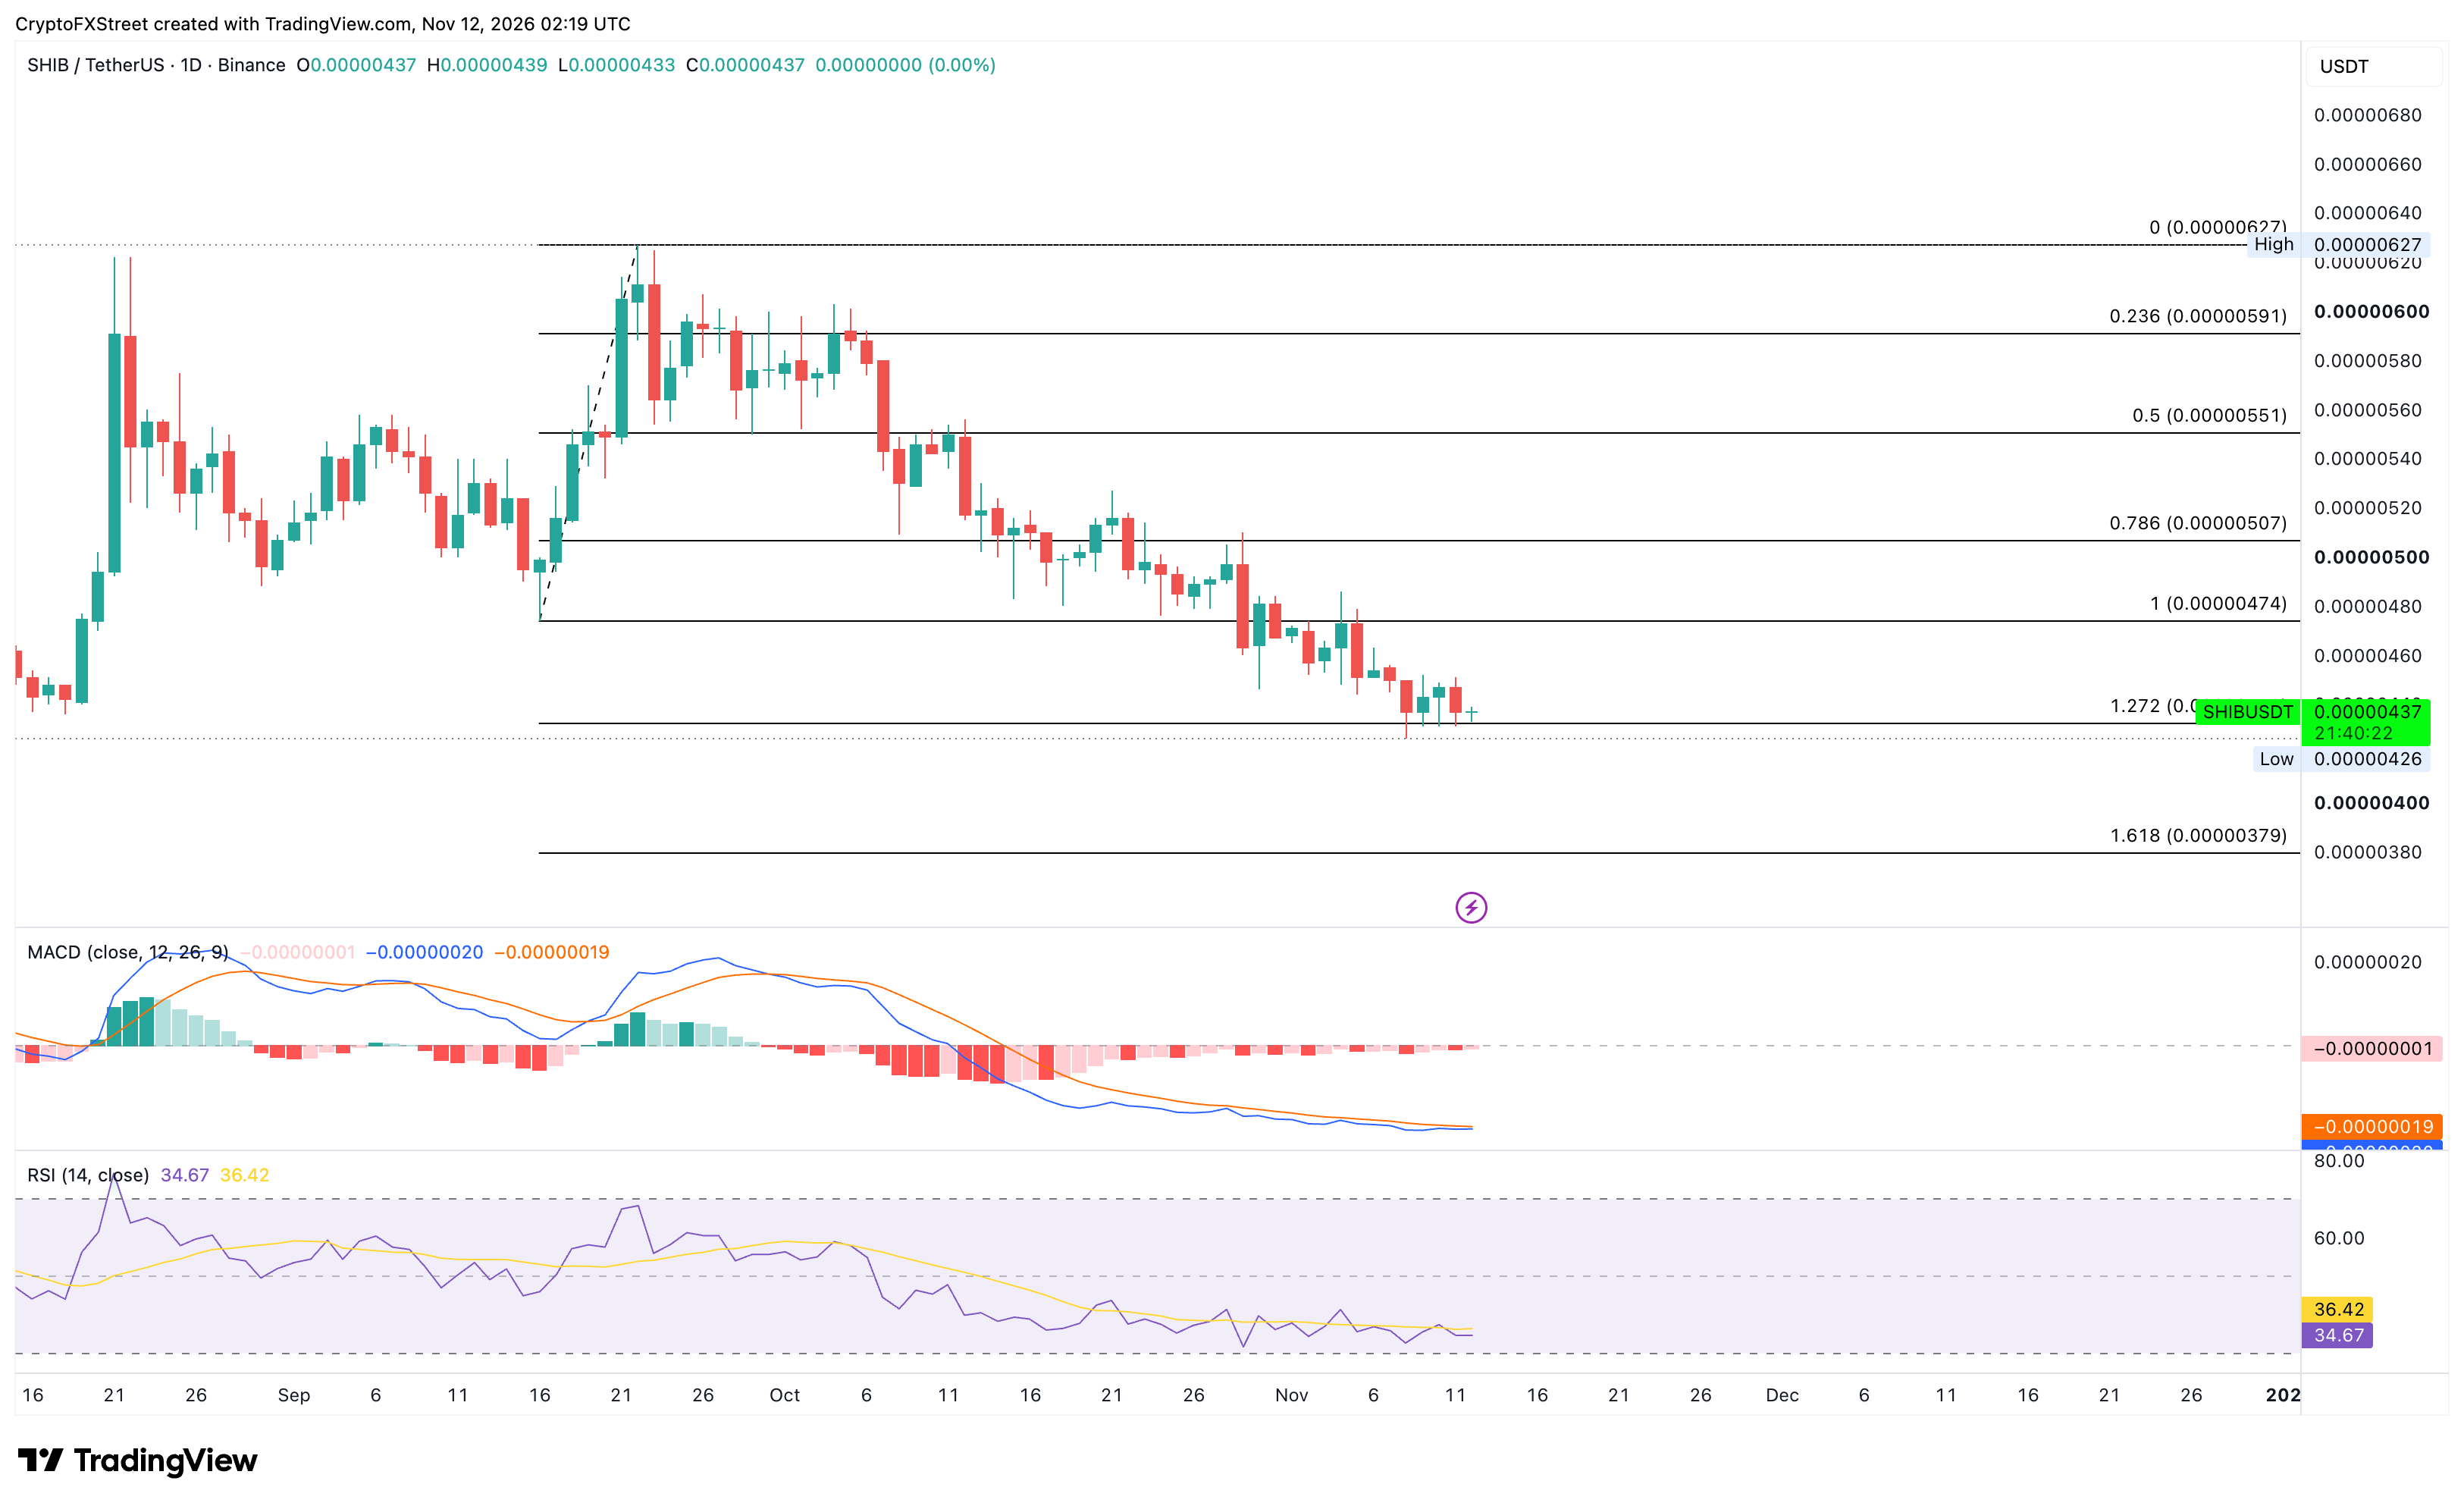
SHIB/USDT daily price chart.

A potential rebound in Shiba Inu could target the $0.00000474 level, a breakout above which could pave the path toward the $0.00000500 psychological level.

Pepe technical analysis: Sharp pullback flips the momentum bearish

PEPE was around $0.00000460, holding steady after a 16% decline the previous day. The pullback approaches a rising support trendline connecting the September 11 and October 8 lows near $0.00000425, reinforced by a horizontal level marked by the August 21 high at $0.00000423.

The 16% decline on Wednesday flipped momentum bearish, with the MACD crossing below its signal line and the RSI dropping below the midline to 47.

The path of least resistance for the frog-themed meme coin implies a decline toward the $0.0000043 support zone. A confirmed breakout below this level would reverse the rising trend supported by an ascending trendline, opening the door to the $0.00000364 level set by the October 8 low.
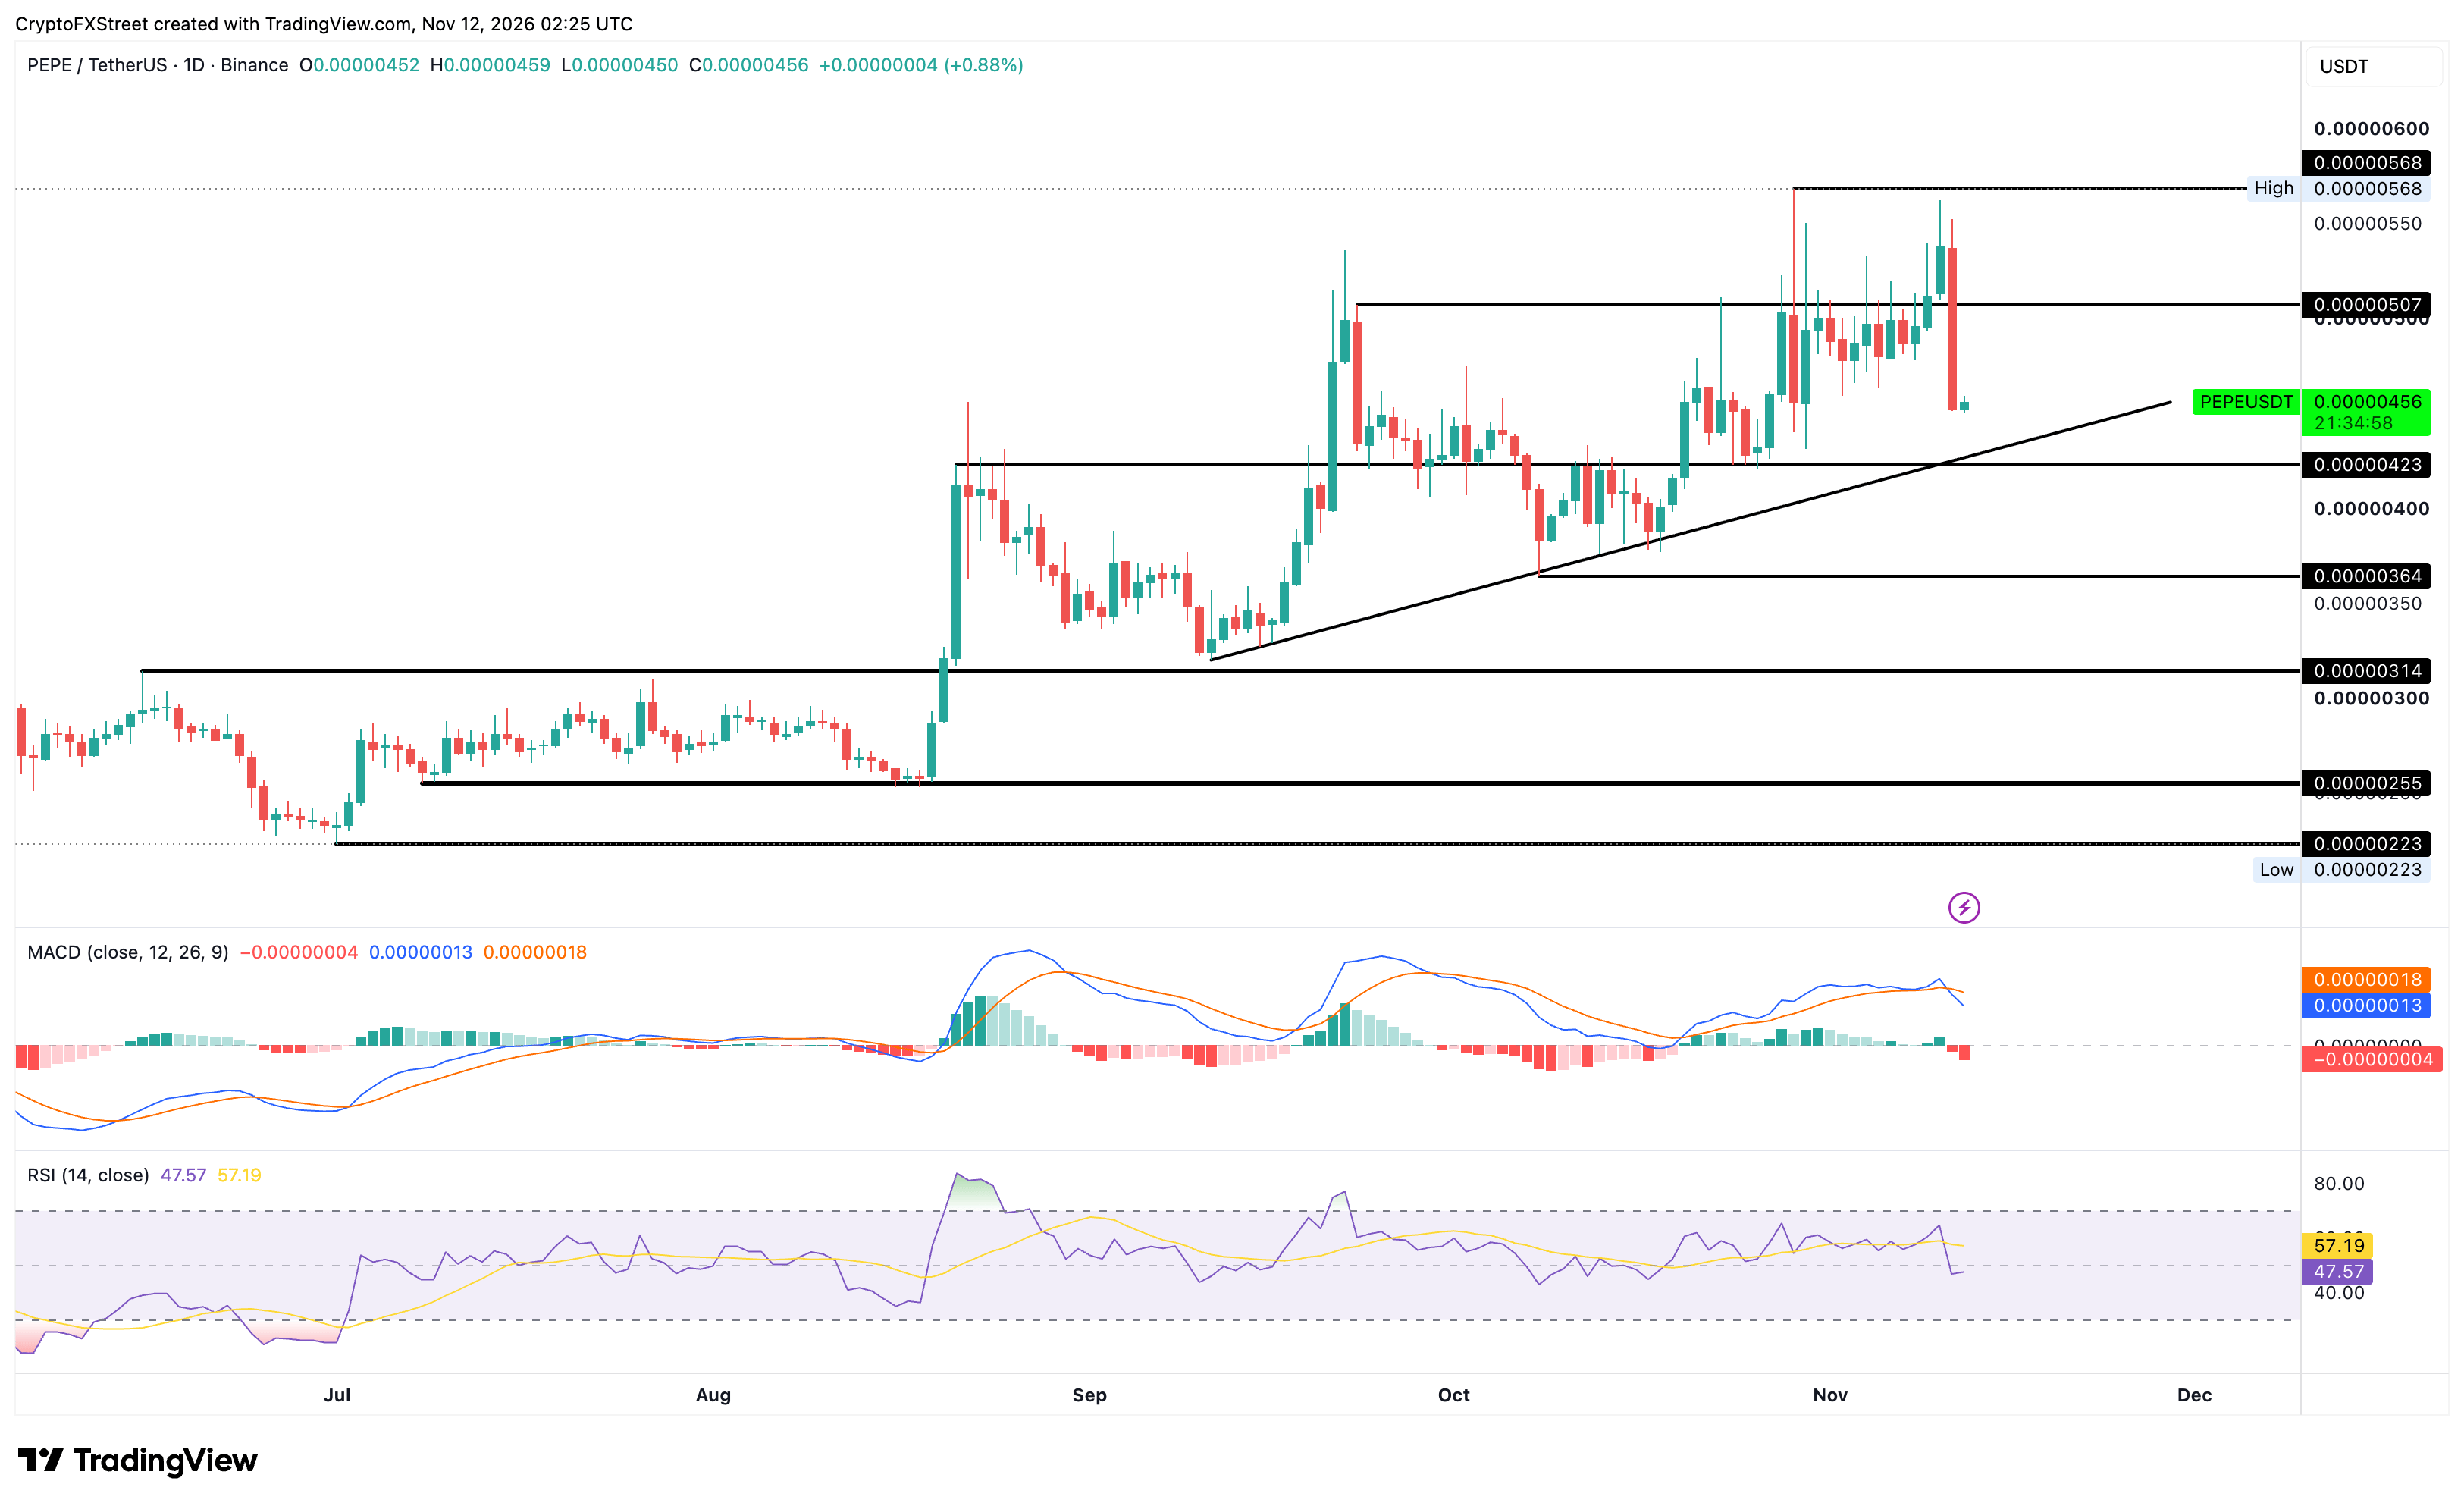
PEPE/USDT daily price chart.

Looking up, Pepe must reclaim the $0.00000500 psychological level, followed by the October 29 high at $0.00000568, to further extend the upward trend.

(The technical analysis of this story was written with the help of an AI tool. Know more.)

Disclaimer: For information purposes only. Past performance is not indicative of future results.
placeholder
Gold Price Analysis Today | Forex Gold Analysis | XAU/USD Analysis - November 11, 2026Get the latest gold price analysis, forex gold insights, and XAU/USD analysis for November 11, 2026. Read on for the details.
Author  Mitrade
Nov 11, Wed
Get the latest gold price analysis, forex gold insights, and XAU/USD analysis for November 11, 2026. Read on for the details.
placeholder
Nvidia slid 7.7% after hours while AMD and Broadcom rose — the AI trade changed hands, it didn't breakNvidia closed Wednesday at 173.73, up 2.87%, then fell as much as 8.1% to 159.44 after reports that its board was preparing for a possible leadership change. The same session, the Philadelphia Semiconductor Index rose 5.7% with all 30 components higher, CoreWeave jumped 24.7% on 168% revenue growth, and Micron added 11.9%. If AI demand were being repriced, AMD and Broadcom would not be bid. This is a governance discount on one name, and 204.54 — the 200-day average — is the level that settles it.
Author  Irene Q.
Nov 12, Thu
Nvidia closed Wednesday at 173.73, up 2.87%, then fell as much as 8.1% to 159.44 after reports that its board was preparing for a possible leadership change. The same session, the Philadelphia Semiconductor Index rose 5.7% with all 30 components higher, CoreWeave jumped 24.7% on 168% revenue growth, and Micron added 11.9%. If AI demand were being repriced, AMD and Broadcom would not be bid. This is a governance discount on one name, and 204.54 — the 200-day average — is the level that settles it.
placeholder
US October PPI Preview: Fed Rate Hike Expectations Rise, PPI May Be Key Variable; How Will US Stocks, Dollar, and Gold Move?On Friday (Nov. 13) Eastern Time, the U.S. will release the October Producer Price Index (PPI). Following the October CPI once again exceeding expectations, the market will look to the PP
Author  TradingKey
Nov 12, Thu
On Friday (Nov. 13) Eastern Time, the U.S. will release the October Producer Price Index (PPI). Following the October CPI once again exceeding expectations, the market will look to the PP
placeholder
Gold hit a one-year low while central banks bought 321 tonnes — the sellers were never the ones you thinkSpot gold closed at 3,876 on Thursday, down 2.8% and its lowest close in more than a year, with an intraday low near 3,852. The dollar is at a 19-month high of 103.21 and the 10-year yield is at 5.10%, so the price move is easy to explain. What is harder to explain is who sold: central banks bought 321 tonnes in Q3, the PBoC added for a 24th straight month, ETF holdings are near a record 4,256 tonnes, and roughly 95% of the futures selling came from non-reportable and sovereign-type accounts rather than hedge funds. This piece separates the two books that have to balance.
Author  Irene Q.
Yesterday 02: 40
Spot gold closed at 3,876 on Thursday, down 2.8% and its lowest close in more than a year, with an intraday low near 3,852. The dollar is at a 19-month high of 103.21 and the 10-year yield is at 5.10%, so the price move is easy to explain. What is harder to explain is who sold: central banks bought 321 tonnes in Q3, the PBoC added for a 24th straight month, ETF holdings are near a record 4,256 tonnes, and roughly 95% of the futures selling came from non-reportable and sovereign-type accounts rather than hedge funds. This piece separates the two books that have to balance.
placeholder
Brent rose 3.3% and US crude stocks built 4.66 million barrels in the same weekBrent January settled at 95.82, up 3.3%, and WTI at 88.74, up 2.55%, after the US signalled it would not pursue a deal with Iran and attacks on Gulf shipping continued. In the same week, EIA data showed US crude inventories rising 4.657 million barrels against expectations of a 1.1 million draw, with gasoline up another 1.799 million. OPEC output also rebounded 1.96 million barrels a day to 27.16 million in October, led by Saudi Arabia at 10.56 million. This piece separates the geopolitical premium from the physical balance and lays out where each side of the trade is anchored.
Author  Irene Q.
Yesterday 03: 06
Brent January settled at 95.82, up 3.3%, and WTI at 88.74, up 2.55%, after the US signalled it would not pursue a deal with Iran and attacks on Gulf shipping continued. In the same week, EIA data showed US crude inventories rising 4.657 million barrels against expectations of a 1.1 million draw, with gasoline up another 1.799 million. OPEC output also rebounded 1.96 million barrels a day to 27.16 million in October, led by Saudi Arabia at 10.56 million. This piece separates the geopolitical premium from the physical balance and lays out where each side of the trade is anchored.
Related Instrument
goTop
quote