

Ripple and Stellar outlook: XRP consolidates losses, XLM extends recovery

Source Fxstreet
  • XRP hovers around $1.055 on Thursday after falling over 5% so far this week.
  • XLM extends mild recovery, trading around $0.148 following a 1.73% rebound the previous day.
  • Weakening on-chain metrics cap recovery prospects for both tokens, while momentum indicators show stretched downside conditions.

Ripple (XRP) and Stellar (XLM) show mild signs of recovery on Thursday, but bears continue to weigh on both cryptocurrencies. XRP trades near $1.055 while XLM holds modest gains around $0.148. Meanwhile, weakening on-chain activity caps both altcoins’ recovery prospects, despite improving price action.

Cautionary on-chain metrics

CryptoQuant’s summary data shows a bearish outlook for both altcoins. XRP’s spot and futures markets show large whale orders but with sell-side dominance. In addition, the spot market shows heating conditions, highlighting an overall bearish, cautious sentiment bias among Ripple traders.
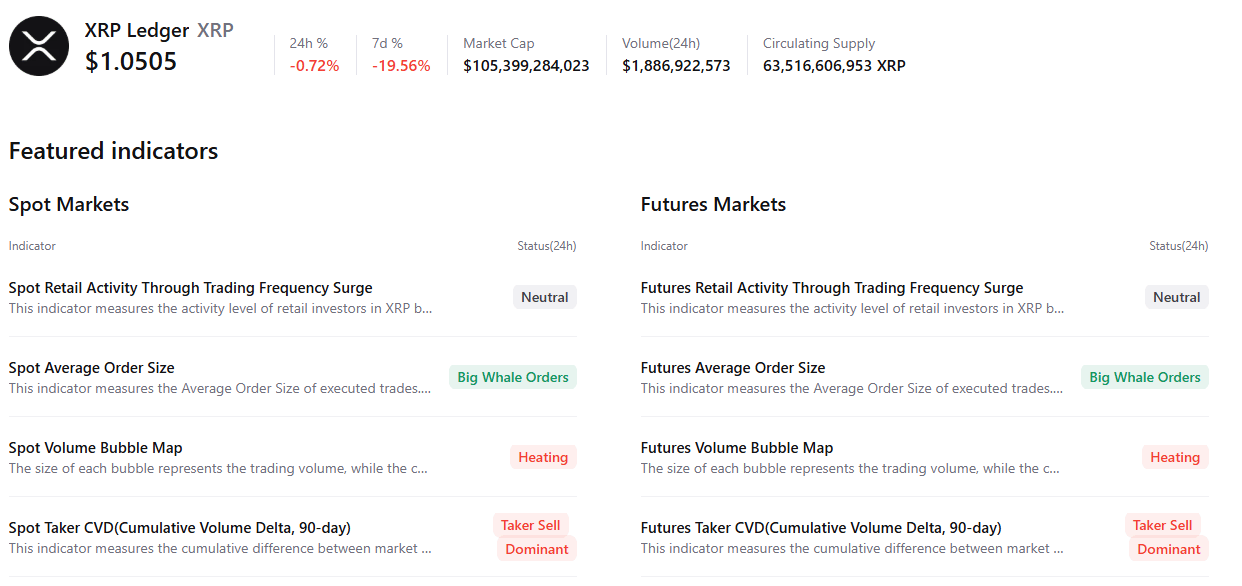
XRP summary chart. Source: CryptoQuant

For XLM, spot and futures markets show sell-side dominance. Meanwhile, the spot market suggests large whale sell orders, with other metrics remaining neutral, highlighting a cautious-to-bearish outlook among XLM traders.
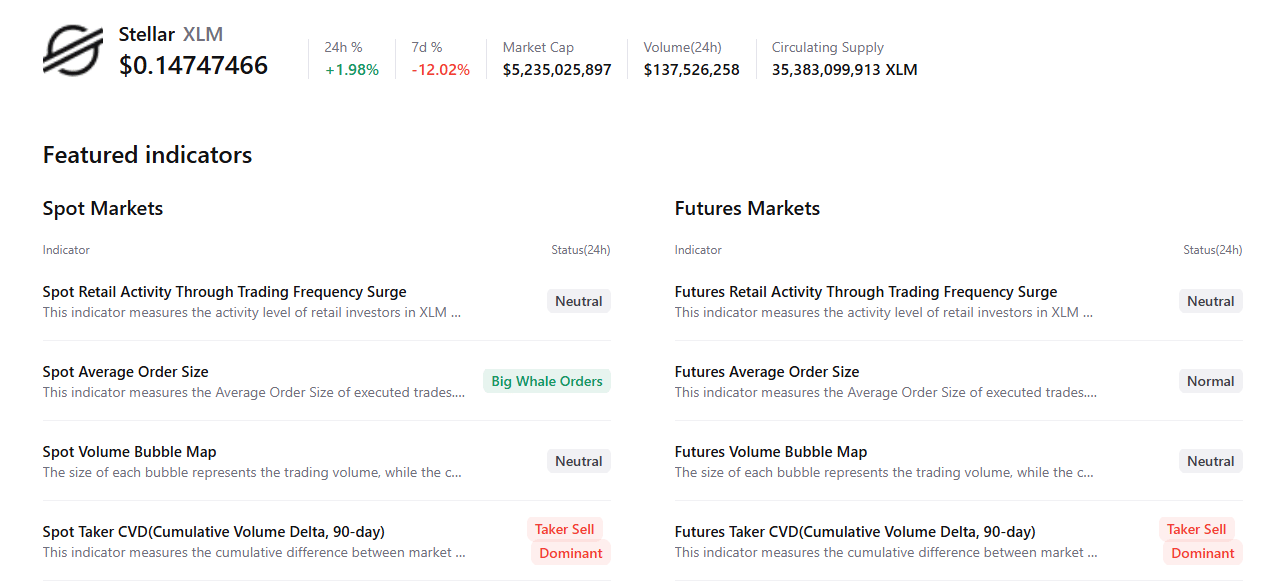
XLM summary outlook. Source: CryptoQuant

XRP technical outlook: Overstretched downside conditions

XRP trades at $1.055 on Thursday, extending a bearish near-term tone as it holds well beneath the 50-day, 100-day, and 200-day Exponential Moving Averages (EMAs) at $1.274, $1.293, and $1.354, respectively.

The Relative Strength Index (RSI) sits in oversold territory near 24, hinting at stretched downside conditions. At the same time, the Moving Average Convergence Divergence (MACD) remains negative, suggesting persistent but gradually easing selling pressure.

On the topside, initial resistance is seen at the horizontal barrier around $1.160, followed by the $1.300 region ahead of the EMA cluster starting at the 200-day EMA near $1.354; above there, higher resistances are located at $1.540 and $1.900.

On the downside, immediate support is aligned with the psychological $1.000 handle, and a sustained break below this floor would likely expose XRP to a deeper corrective phase despite the already oversold momentum backdrop.
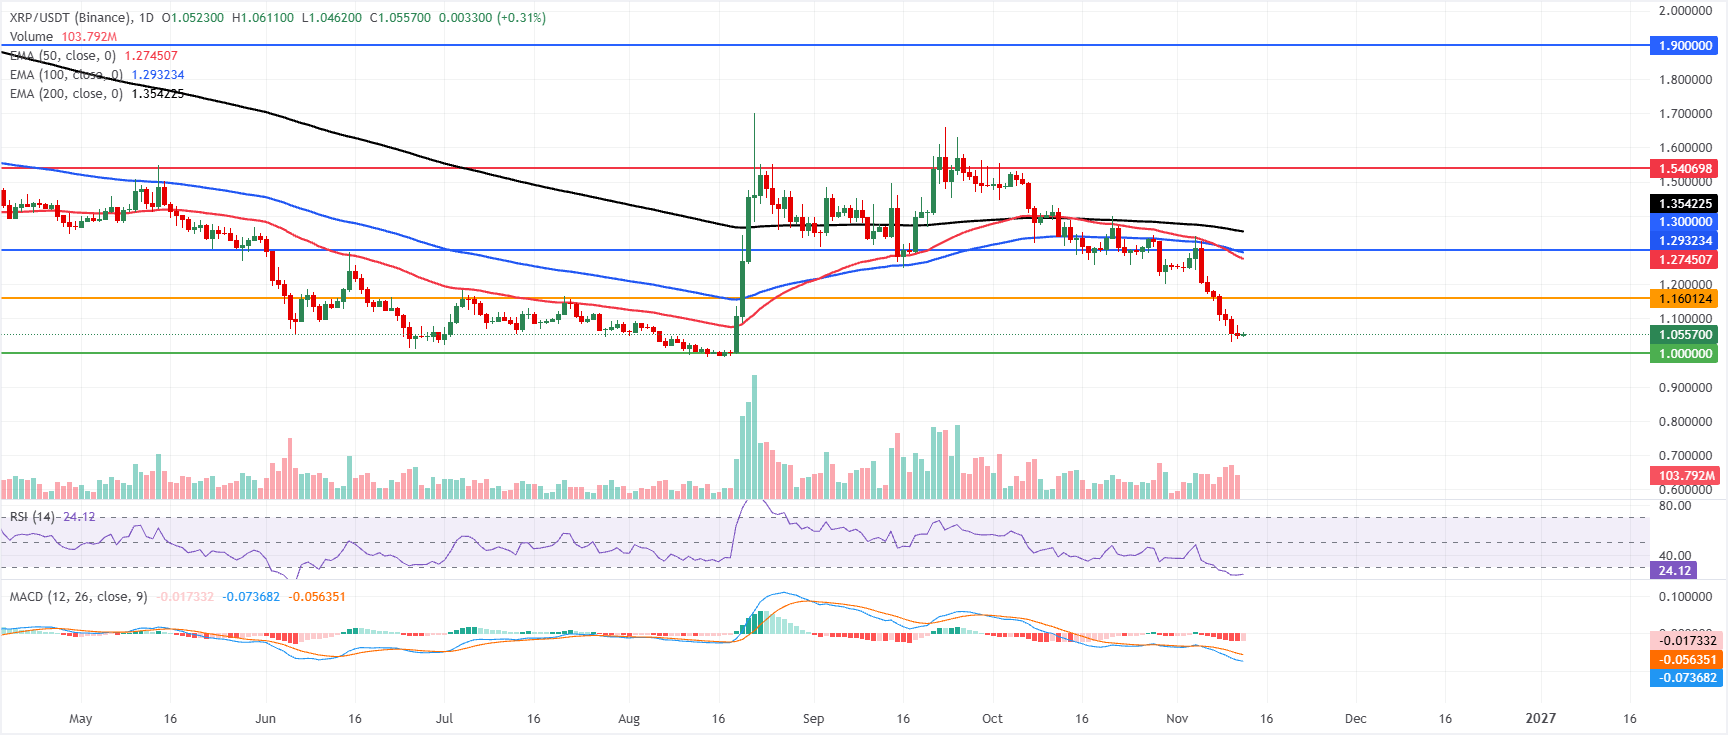
XRP/USDT daily chart

XLM technical outlook: Weakening bearish trend

XLM price trades at $0.148 on Thursday, extending its retreat below the major EMAs and keeping a bearish near-term bias. The 50-day EMA at $0.173, the 100-day EMA at $0.179 and the 200-day EMA at $0.185 all sit overhead as a layered supply zone, suggesting rallies are likely to be capped while price remains under this cluster.

The RSI at 33 hovers just above oversold territory, hinting at persistent downside pressure, while the MACD remains slightly negative, reinforcing the notion of a weakening trend rather than a confirmed reversal.

On the topside, initial resistance is seen at the horizontal barrier around $0.153, followed by the 50-day EMA at $0.173, which converge into a more significant hurdle should buyers attempt a bounce. Above those, the 100-day EMA at $0.179, the 200-day EMA at $0.185, the former trendline break area near $0.208 and the higher horizontal cap at $0.234 outline successive recovery targets.

On the downside, the only nearby structural support is the horizontal level at $0.136, where a break would likely open the door to a deeper bearish extension.
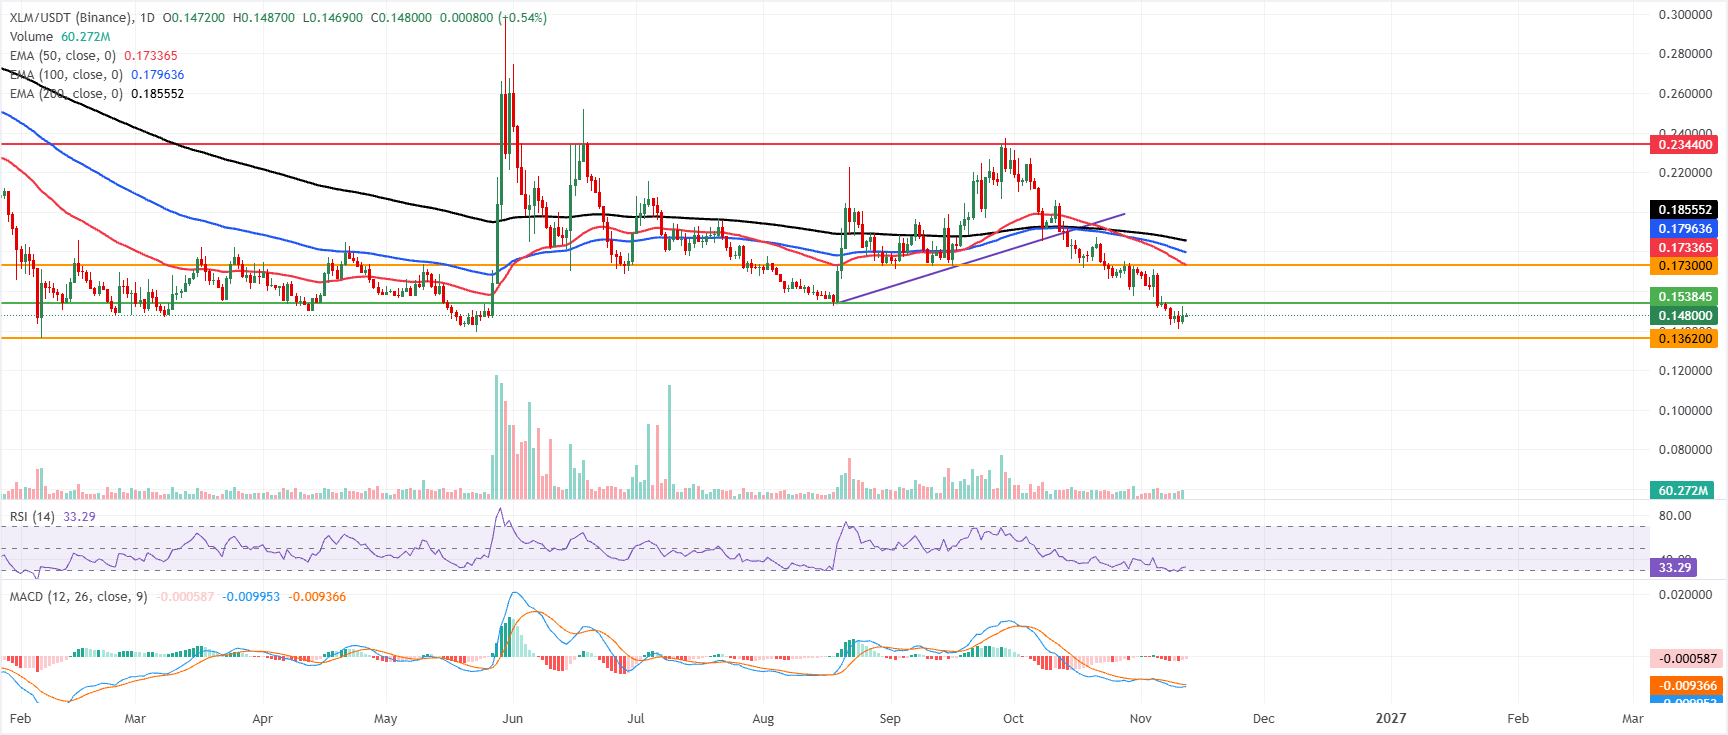
XLM/USDT daily chart.

(The technical analysis of this story was written with the help of an AI tool. Know more.)

Disclaimer: For information purposes only. Past performance is not indicative of future results.
placeholder
China's factories are pricing in 5.7%. Its shoppers are pricing in 0.7%.China's October PPI rose 5.7% year on year, the fastest since June 2022, while CPI slowed to 0.7% and core CPI to 0.8%. Input prices rose faster than factory-gate prices, squeezing mid-stream margins by roughly five percentage points. The Hang Seng fell 0.13% on a day the S&P 500 rose 2.35%, the only major market to sit out the risk-on session.
Author  Irene Q.
Nov 10, Tue
China's October PPI rose 5.7% year on year, the fastest since June 2022, while CPI slowed to 0.7% and core CPI to 0.8%. Input prices rose faster than factory-gate prices, squeezing mid-stream margins by roughly five percentage points. The Hang Seng fell 0.13% on a day the S&P 500 rose 2.35%, the only major market to sit out the risk-on session.
placeholder
Gold Price Analysis Today | Forex Gold Analysis | XAU/USD Analysis - November 11, 2026Get the latest gold price analysis, forex gold insights, and XAU/USD analysis for November 11, 2026. Read on for the details.
Author  Mitrade
Yesterday 02: 42
Get the latest gold price analysis, forex gold insights, and XAU/USD analysis for November 11, 2026. Read on for the details.
placeholder
Gold Tumbles Toward $4,000 as Hotter-Than-Expected CPI Boosts Fed Rate-Hike Bets, Bulls Eye $3,975 SupportAs of the Asian session on Wednesday (November 11), gold prices (XAUUSD) rebounded slightly after a sharp decline in the previous session, last trading near $4,040, up about 0.3% on the d
Author  TradingKey
Yesterday 02: 51
As of the Asian session on Wednesday (November 11), gold prices (XAUUSD) rebounded slightly after a sharp decline in the previous session, last trading near $4,040, up about 0.3% on the d
placeholder
Core CPI stuck at 0.3% for a third straight month — and BLS couldn't publish the number that would explain itOctober headline CPI rose 0.4% m/m against a 0.3% consensus, and core rose 0.3% for a third consecutive month against 0.2% expected. BLS published no year-on-year figures because October 2025 collection was lost to the government shutdown. Energy cooled to 0.7% from 5.2% — shelter, food and transport services did the rest. The 2-year yield jumped 18 to 21 basis points, the 10-year added 12, and the dollar closed at 102.25.
Author  Irene Q.
Yesterday 03: 09
October headline CPI rose 0.4% m/m against a 0.3% consensus, and core rose 0.3% for a third consecutive month against 0.2% expected. BLS published no year-on-year figures because October 2025 collection was lost to the government shutdown. Energy cooled to 0.7% from 5.2% — shelter, food and transport services did the rest. The 2-year yield jumped 18 to 21 basis points, the 10-year added 12, and the dollar closed at 102.25.
placeholder
Bitcoin lost its 200-day average — but the exit started three sessions before the CPIBitcoin fell 2.5% to about $73,400 on 11 November, an 11-week low, breaking its 200-day moving average near $73,100. The 24-hour liquidation tally reached $632 to $705 million, roughly 82% of it longs. But spot ETF outflows began three sessions earlier and USDT's market cap has shrunk $6.6 billion in 60 days — the leveraged length left before the inflation print did. A double top at 81,890 and 81,080 leaves a measured target of 69,366.
Author  Suzie
Yesterday 03: 22
Bitcoin fell 2.5% to about $73,400 on 11 November, an 11-week low, breaking its 200-day moving average near $73,100. The 24-hour liquidation tally reached $632 to $705 million, roughly 82% of it longs. But spot ETF outflows began three sessions earlier and USDT's market cap has shrunk $6.6 billion in 60 days — the leveraged length left before the inflation print did. A double top at 81,890 and 81,080 leaves a measured target of 69,366.
Related Instrument
goTop
quote