

Ripple Price Forecast: XRP sell-off persists as $1.00 support level beckons

Source Fxstreet
  • XRP falls below $1.10, reflecting a broader, incessant sell-off in the crypto market.
  • Institutional and retail demand remains subdued amid XRP spot ETF outflows and declining futures Open Interest.
  • XRP bearish pressure is mounting, with a negative MACD histogram and oversold RSI.

Ripple (XRP) sustains downside pressure, slipping below $1.00 at the time of writing on Tuesday. The path of least resistance remains firmly downward, as the token’s upside is capped by downtrending technical indicators. 

XRP mirrors the broader crypto market’s weakness, with Bitcoin (BTC) falling below $75,000. This has persisted for the sixth straight day, aligning with risk-off sentiment driven by macro uncertainties and other factors.

Traders are looking ahead to the United States (US) Consumer Price Index (CPI) report later on Tuesday, an inflation gauge the Federal Reserve (Fed) uses to shape monetary policy direction.

ETF and retail demand fade as XRP falters 

XRP spot Exchange-Traded Funds (ETFs) recorded $10 million in outflows on Monday, backing the risk-off sentiment. Looking back, activity had remained muted for four consecutive days since Tuesday last week. The lack of demand for XRP digital investment products indicates that the token lacks cushioning against headwinds, raising the odds of an extended downtrend.

Nonetheless, cumulative inflows stand at $1.8 billion, with net assets under management at $1.24. This setup suggests that investor interest in the underlying token is positive in the long term. 
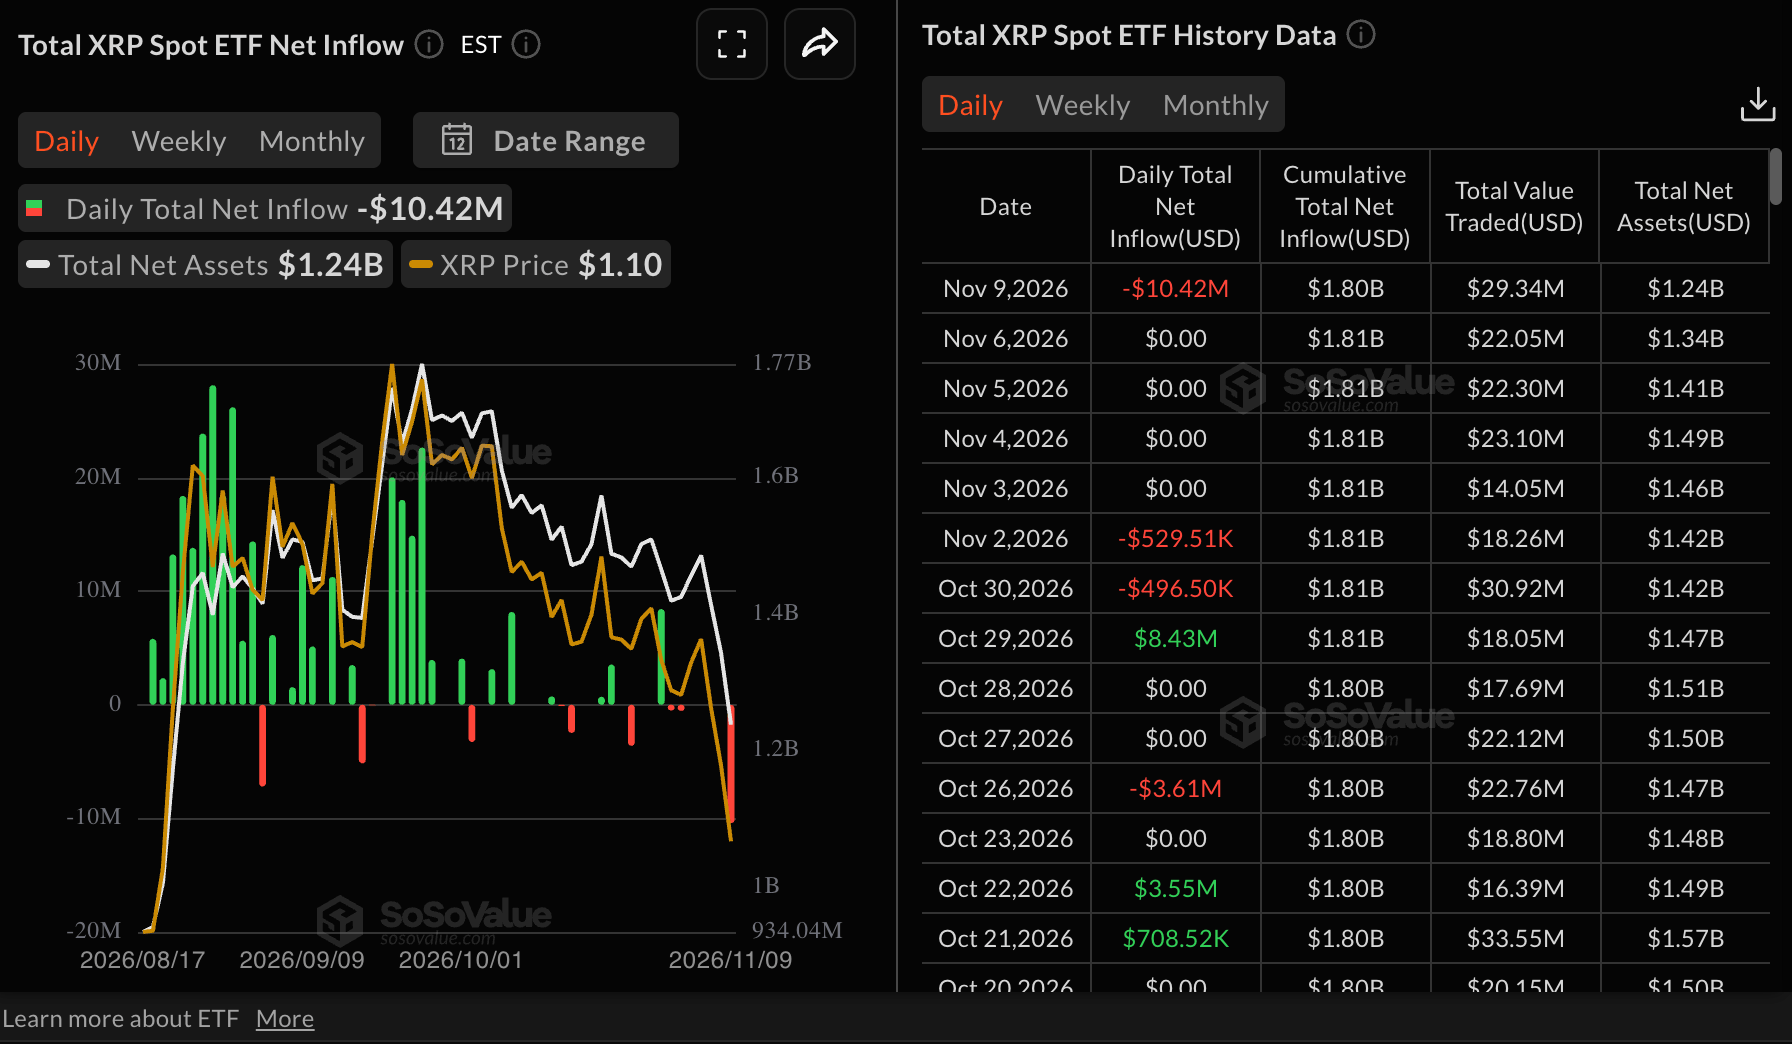
XRP ETF flows | Source: SoSoValue

The derivatives market, however, remains largely subdued, with perpetual futures Open Interest (OI) at 2.24 billion XRP on Tuesday, down only marginally from 2.26 billion XRP the previous day. More broadly, OI holds below November highs of 2.35 billion XRP, and September’s 2.46 billion, according to CoinGlass. If retail demand stays low, price recovery may be an uphill battle, while sell-off odds multiply toward the $1.00 critical zone.

Technical analysis: XRP at risk of deeper losses

XRP trades at $1.08, extending a bearish near-term bias as it holds well below the main Exponential Moving Averages (EMAs) and a descending resistance trend line. The 50-day EMA at $1.30, the 100-day EMA at $1.30, and the 200-day EMA at $1.35 all sit overhead, suggesting the market is firmly capped by medium and longer-term supply, while the SuperTrend indicator at $1.26 reinforces that rallies remain corrective within a broader downtrend.

The Relative Strength Index (RSI) has slipped to about 25, entering oversold territory, and the Moving Average Convergence Divergence (MACD) histogram remains negative near, suggesting bearish momentum is stretched but not yet showing a convincing reversal signal.

Chart Analysis XRP/USDT (Binance)

Initial resistance emerges at the SuperTrend line around $1.26, ahead of a confluence band between the 50-day EMA at $1.29 and the downward resistance trendline break price near $1.30, which together define the first major hurdle for any rebound. Further up, the 100-day EMA at $1.30 and the 200-day EMA at $1.35 form a broader supply zone that would need to be reclaimed to ease the prevailing bearish structure.

With no clear nearby support levels on the daily chart, price remains vulnerable to further downside as long as it trades beneath this stacked resistance cluster.

(The technical analysis of this story was written with the help of an AI tool. Know more.)

Open Interest, funding rate FAQs

Higher Open Interest is associated with higher liquidity and new capital inflow to the market. This is considered the equivalent of increase in efficiency and the ongoing trend continues. When Open Interest decreases, it is considered a sign of liquidation in the market, investors are leaving and the overall demand for an asset is on a decline, fueling a bearish sentiment among investors.

Funding fees bridge the difference between spot prices and prices of futures contracts of an asset by increasing liquidation risks faced by traders. A consistently high and positive funding rate implies there is a bullish sentiment among market participants and there is an expectation of a price hike. A consistently negative funding rate for an asset implies a bearish sentiment, indicating that traders expect the cryptocurrency’s price to fall and a bearish trend reversal is likely to occur.

Disclaimer: For information purposes only. Past performance is not indicative of future results.
placeholder
Gold Price Analysis Today | Forex Gold Analysis | XAU/USD Analysis - November 11, 2026Get the latest gold price analysis, forex gold insights, and XAU/USD analysis for November 11, 2026. Read on for the details.
Author  Mitrade
Nov 11, Wed
Get the latest gold price analysis, forex gold insights, and XAU/USD analysis for November 11, 2026. Read on for the details.
placeholder
Nvidia slid 7.7% after hours while AMD and Broadcom rose — the AI trade changed hands, it didn't breakNvidia closed Wednesday at 173.73, up 2.87%, then fell as much as 8.1% to 159.44 after reports that its board was preparing for a possible leadership change. The same session, the Philadelphia Semiconductor Index rose 5.7% with all 30 components higher, CoreWeave jumped 24.7% on 168% revenue growth, and Micron added 11.9%. If AI demand were being repriced, AMD and Broadcom would not be bid. This is a governance discount on one name, and 204.54 — the 200-day average — is the level that settles it.
Author  Irene Q.
Nov 12, Thu
Nvidia closed Wednesday at 173.73, up 2.87%, then fell as much as 8.1% to 159.44 after reports that its board was preparing for a possible leadership change. The same session, the Philadelphia Semiconductor Index rose 5.7% with all 30 components higher, CoreWeave jumped 24.7% on 168% revenue growth, and Micron added 11.9%. If AI demand were being repriced, AMD and Broadcom would not be bid. This is a governance discount on one name, and 204.54 — the 200-day average — is the level that settles it.
placeholder
US October PPI Preview: Fed Rate Hike Expectations Rise, PPI May Be Key Variable; How Will US Stocks, Dollar, and Gold Move?On Friday (Nov. 13) Eastern Time, the U.S. will release the October Producer Price Index (PPI). Following the October CPI once again exceeding expectations, the market will look to the PP
Author  TradingKey
Nov 12, Thu
On Friday (Nov. 13) Eastern Time, the U.S. will release the October Producer Price Index (PPI). Following the October CPI once again exceeding expectations, the market will look to the PP
placeholder
Gold hit a one-year low while central banks bought 321 tonnes — the sellers were never the ones you thinkSpot gold closed at 3,876 on Thursday, down 2.8% and its lowest close in more than a year, with an intraday low near 3,852. The dollar is at a 19-month high of 103.21 and the 10-year yield is at 5.10%, so the price move is easy to explain. What is harder to explain is who sold: central banks bought 321 tonnes in Q3, the PBoC added for a 24th straight month, ETF holdings are near a record 4,256 tonnes, and roughly 95% of the futures selling came from non-reportable and sovereign-type accounts rather than hedge funds. This piece separates the two books that have to balance.
Author  Irene Q.
Yesterday 02: 40
Spot gold closed at 3,876 on Thursday, down 2.8% and its lowest close in more than a year, with an intraday low near 3,852. The dollar is at a 19-month high of 103.21 and the 10-year yield is at 5.10%, so the price move is easy to explain. What is harder to explain is who sold: central banks bought 321 tonnes in Q3, the PBoC added for a 24th straight month, ETF holdings are near a record 4,256 tonnes, and roughly 95% of the futures selling came from non-reportable and sovereign-type accounts rather than hedge funds. This piece separates the two books that have to balance.
placeholder
Brent rose 3.3% and US crude stocks built 4.66 million barrels in the same weekBrent January settled at 95.82, up 3.3%, and WTI at 88.74, up 2.55%, after the US signalled it would not pursue a deal with Iran and attacks on Gulf shipping continued. In the same week, EIA data showed US crude inventories rising 4.657 million barrels against expectations of a 1.1 million draw, with gasoline up another 1.799 million. OPEC output also rebounded 1.96 million barrels a day to 27.16 million in October, led by Saudi Arabia at 10.56 million. This piece separates the geopolitical premium from the physical balance and lays out where each side of the trade is anchored.
Author  Irene Q.
Yesterday 03: 06
Brent January settled at 95.82, up 3.3%, and WTI at 88.74, up 2.55%, after the US signalled it would not pursue a deal with Iran and attacks on Gulf shipping continued. In the same week, EIA data showed US crude inventories rising 4.657 million barrels against expectations of a 1.1 million draw, with gasoline up another 1.799 million. OPEC output also rebounded 1.96 million barrels a day to 27.16 million in October, led by Saudi Arabia at 10.56 million. This piece separates the geopolitical premium from the physical balance and lays out where each side of the trade is anchored.
Related Instrument
goTop
quote