

Pi Network price forecast: PI extends losses as social interest declines

Source Fxstreet
  • Pi Network edges lower on Tuesday, testing the bearish breakout of the $0.0774 support level.
  • PI token’s social dominance score drops to a six-month low, suggesting reduced retail interest.
  • The technical outlook for PI suggests a downside bias, with sellers targeting the all-time low of $0.0704.

Pi Network (PI) is down nearly 2% on Tuesday, extending the previous day’s losses and risking an extended decline toward its record low of $0.0704. PI token’s social dominance score is down to a six-month low, suggesting reduced social interest. The technical outlook for the PI token is bearish as the correction phase gains momentum.

Social chatter softens around PI

Pi Network’s social positioning is declining as it loses share of voice in crypto-related online discussions. Santiment data shows the PI token's social dominance dropped to 0.03% on Monday, marking a six-month low, with a social volume of 2. This implies reduced market chatter about PI, a crucial bullish catalyst tied to speculative demand. 
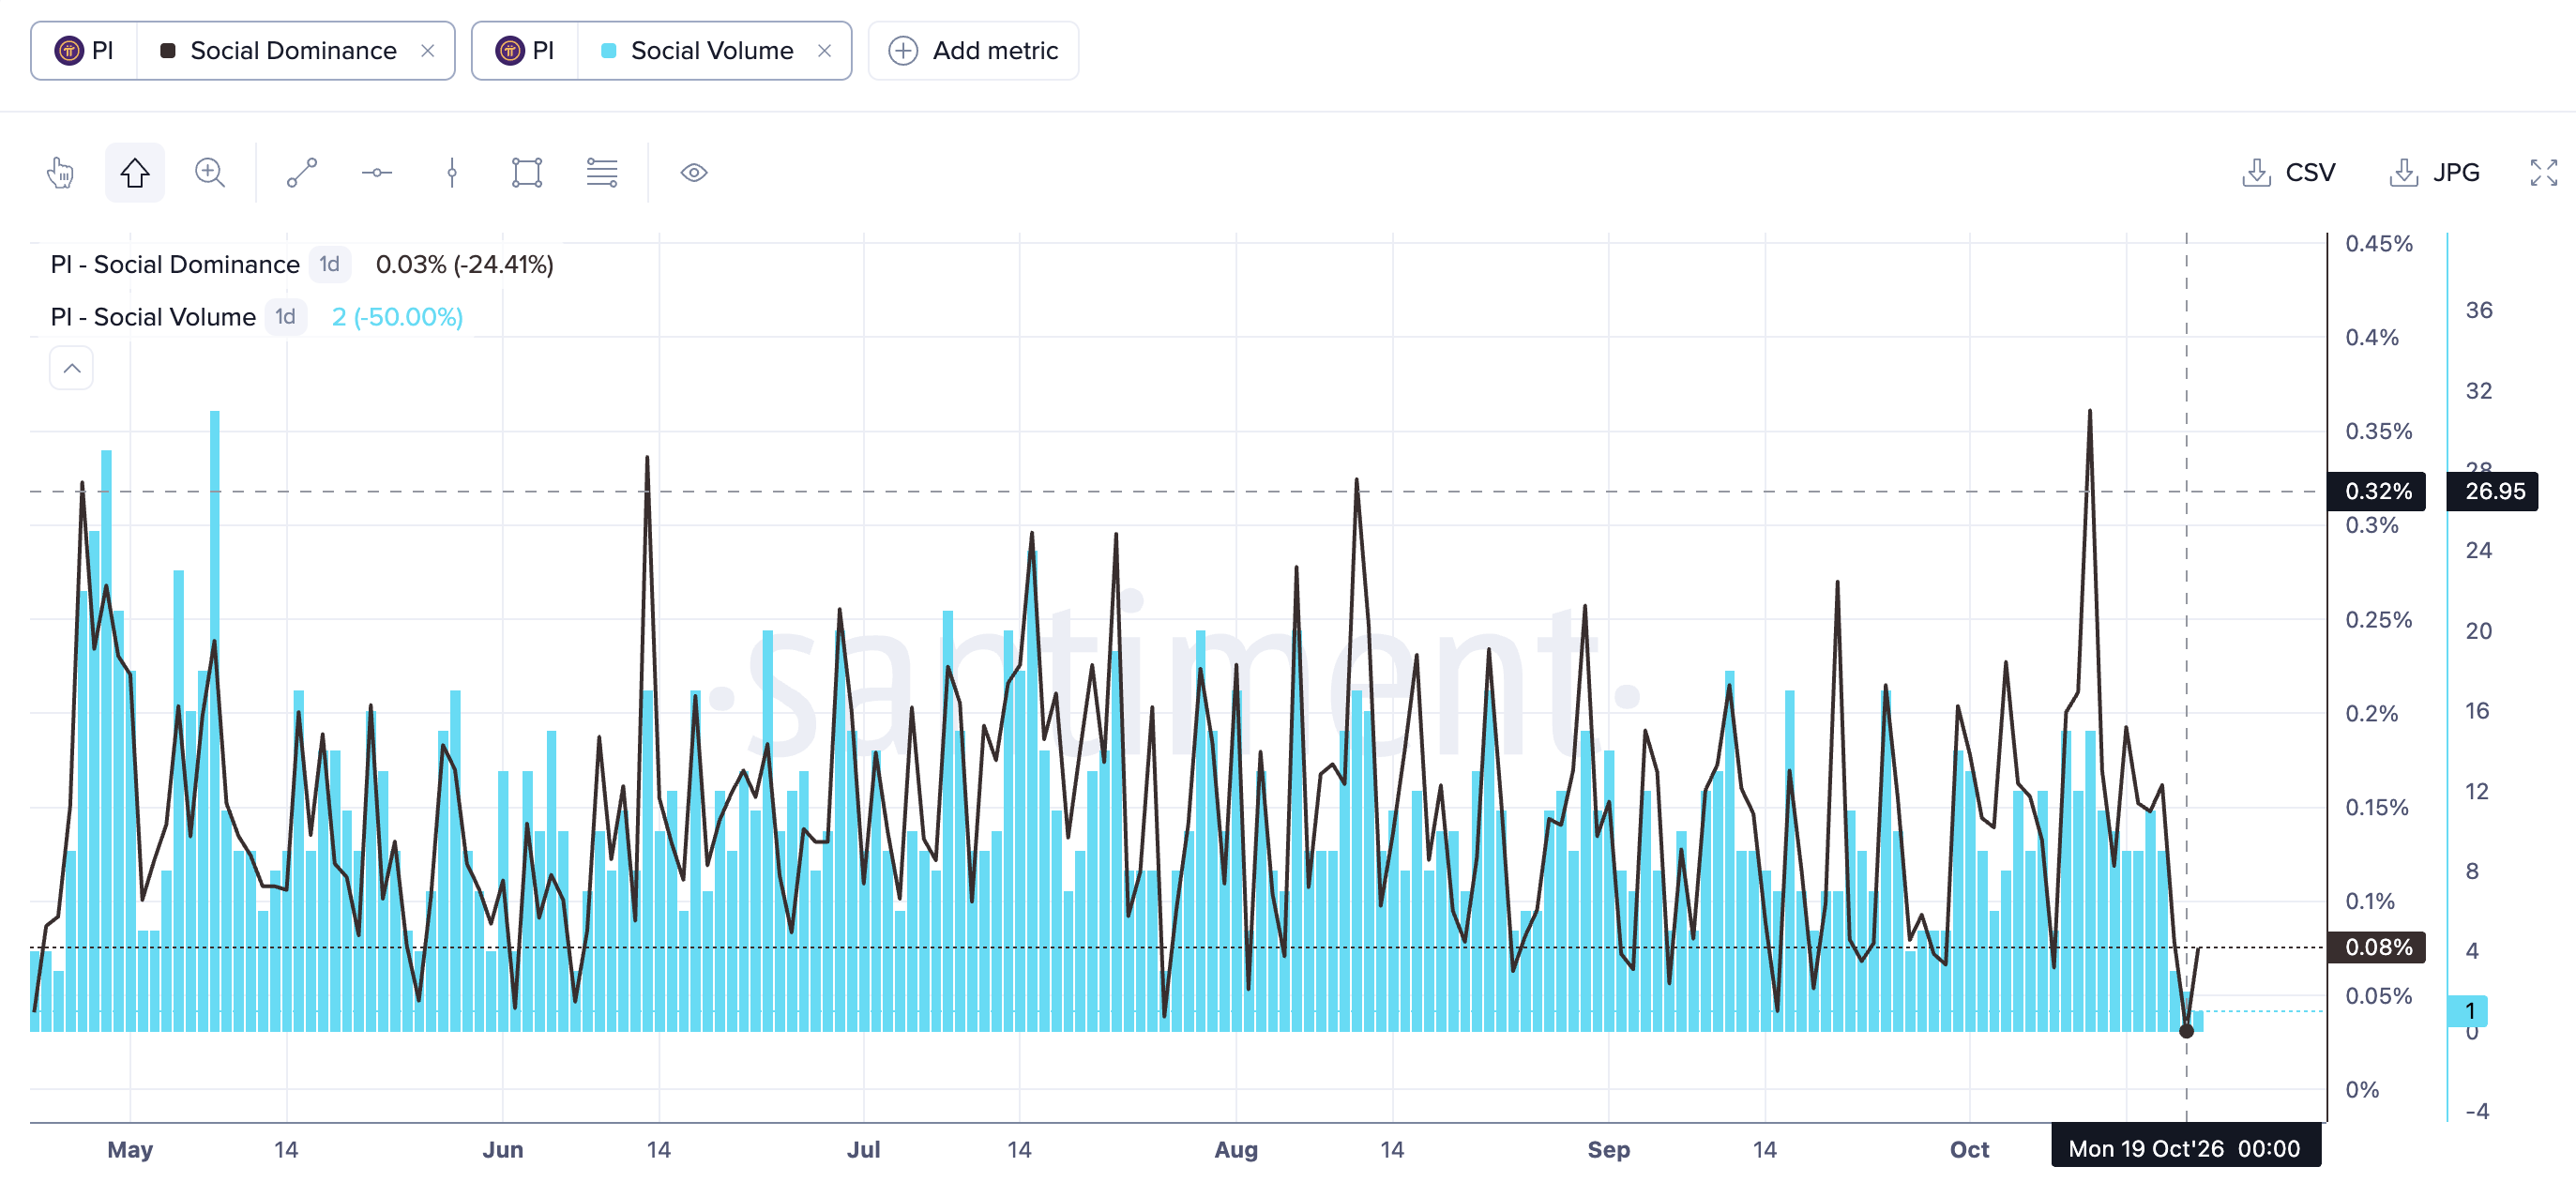
PI social interest data. Source: Santiment

Technical outlook: How low will the Pi Network price go?

Pi Network trades around $0.0772 on Tuesday, extending a long-term bearish trend capped by an overhead resistance trendline, connecting the June 20 and August 22 highs, near $0.0838. PI token's declining trend is also beneath the 50-period Exponential Moving Average (EMA) at $0.0862 and the 200-period EMA at $0.1221.

Momentum reinforces this capped tone, with the Relative Strength Index (RSI) hovering around 35 and Moving Average Convergence Divergence (MACD) in negative territory with a slightly negative histogram, hinting that sellers still control the near-term direction.

A confirmed breakout below the October 8 low at $0.0774 could extend the decline toward the $0.0704 swing low. Any deeper pullbacks will plunge the PI token into a downside price-discovery mode.

Chart Analysis PI/USD (baha Crypto)
PI/USD daily price chart.

On the topside, initial resistance emerges at the downtrend break level around $0.0838, followed closely by a dense cluster formed by the 50-period EMA at $0.0862 and the 23.6% Fibonacci retracement, measured from $0.1394 to $0.0704, at $0.0867. Above this area, the 50% level at $0.1049 and the 200-day EMA at $0.1221 outline the subsequent barrier.

(The technical analysis of this story was written with the help of an AI tool. Know more.)

Disclaimer: For information purposes only. Past performance is not indicative of future results.
placeholder
WTI drops to near $97.50 as US waives Russia oil sanctionsWest Texas Intermediate (WTI) oil price declines after seven days of gains, trading around 97.40 per barrel during Asian hours on Monday.
Author  FXStreet
Yesterday 01: 21
West Texas Intermediate (WTI) oil price declines after seven days of gains, trading around 97.40 per barrel during Asian hours on Monday.
placeholder
Gold Price Analysis Today | Forex Gold Analysis | XAU/USD Analysis - October 19, 2026Get the latest gold price analysis, forex gold insights, and XAU/USD analysis for October 19, 2026. Read on for the details.
Author  Mitrade
Yesterday 02: 11
Get the latest gold price analysis, forex gold insights, and XAU/USD analysis for October 19, 2026. Read on for the details.
placeholder
Gold retests $4,200 as dollar and yields retreat — can bullion clear its hardest level?Spot gold traded near $4,175 on Monday (+0.23%), with an intraday high of $4,187.71 after last week's $4,073 ~ $4,217 range; COMEX futures briefly topped $4,200. The dollar slipped to 101.76 and 10-year yields eased from their highs, but October Fed hike odds near 52% and BofA's sub-$4,000 call still cap the upside. Here are the drivers, the levels and what would flip the script.
Author  Irene Q.
Yesterday 06: 25
Spot gold traded near $4,175 on Monday (+0.23%), with an intraday high of $4,187.71 after last week's $4,073 ~ $4,217 range; COMEX futures briefly topped $4,200. The dollar slipped to 101.76 and 10-year yields eased from their highs, but October Fed hike odds near 52% and BofA's sub-$4,000 call still cap the upside. Here are the drivers, the levels and what would flip the script.
placeholder
Gold Price Analysis Today | Forex Gold Analysis | XAU/USD Analysis - October 20, 2026Get the latest gold price analysis, forex gold insights, and XAU/USD analysis for October 20, 2026. Read on for the details.
Author  Mitrade
11 hours ago
Get the latest gold price analysis, forex gold insights, and XAU/USD analysis for October 20, 2026. Read on for the details.
placeholder
Dollar presses 102 as the 10-year yield sits at 5.14% — and October hike odds are only 17%The dollar index closed at 101.99 (+0.20%) on Monday after briefly topping 102.07, while the 10-year Treasury yield rose to 5.14% and the 2-year hit 4.774% — yet futures price only about a 17% chance of a hike at the October 27-28 FOMC, versus roughly 90% for December. The driver is a global bond selloff, not a Fed repricing: France's 10-year OAT jumped to 4.84% ~ 4.94% and the OAT-Bund spread widened to 140 ~ 146bp. Here are the levels, the cross-asset read-through and what to watch.
Author  Irene Q.
9 hours ago
The dollar index closed at 101.99 (+0.20%) on Monday after briefly topping 102.07, while the 10-year Treasury yield rose to 5.14% and the 2-year hit 4.774% — yet futures price only about a 17% chance of a hike at the October 27-28 FOMC, versus roughly 90% for December. The driver is a global bond selloff, not a Fed repricing: France's 10-year OAT jumped to 4.84% ~ 4.94% and the OAT-Bund spread widened to 140 ~ 146bp. Here are the levels, the cross-asset read-through and what to watch.
goTop
quote