


Gold Price Analysis Today | Forex Gold Analysis | XAU/USD Analysis - October 19, 2026


Today's Gold Price
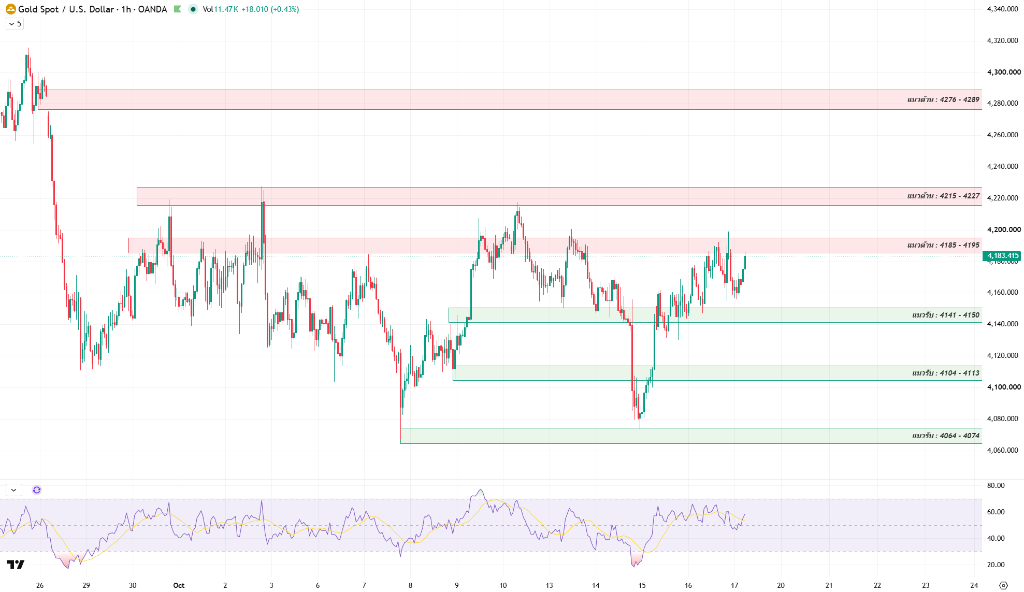
Gold price chart for today
*0% Commission and Low Spreads 0️⃣
*$50,000 in Free Virtual Funds 💰
*$100 New Customer Bonus 🎁
Gold (XAU/USD) traded around $4,183 on the morning of October 19, 2026, after rebounding from the $4,064–4,074 support base to test resistance at $4,185–4,195. The move was supported by the probability of a Fed pause in October rising to 83% after Kevin Warsh struck a cautious tone at the IMF. The World Gold Council reported that central banks bought a net 39 tonnes of gold in August, led by China’s 22 consecutive months of accumulation. Brent crude’s rise to $109.86 on the Hormuz crisis carries inflation risks. The key question is whether gold can break through $4,185–4,195 to open the way toward $4,215–4,227.
Today's Key Points
| Key Points |
|
|
|
Markets price an 83% chance of a Fed pause in October after Warsh strikes a cautious tone, amid oil above $100
Forward markets raised the probability that the Fed will hold rates at the October 27–28 FOMC meeting to 83% from 72% after Fed Chair Kevin Warsh gave no further signal of policy tightening at the IMF forum in Bangkok. That eased investors’ near-term concerns. Although September CPI and PPI inflation remained high, markets continued to assign weight to a December rate increase.
Meanwhile, the Strait of Hormuz crisis following attacks on commercial vessels lifted Brent crude to $109.86 and kept WTI above $100. This has a double-edged effect: it supports safe-haven demand, while the Nasdaq’s 4.5% weekly decline on concerns over AI-business debt also draws funds into gold. But higher oil prices remain an inflation catalyst that could curb the recovery.
This week’s U.S. housing, PMI and consumer-confidence signals will shape the interest-rate outlook
Gold’s direction this week faces an important test from U.S. economic data, beginning Tuesday with housing starts and building permits, which are sensitive to high interest rates. A slowdown from 1.275 million units would reinforce the view that financing costs are beginning to weigh on the economy. Thursday brings jobless-claims data, after the prior reading of 199,000 claims.
Friday’s release of October flash PMI is a key focus. The previous reading of 58.4 indicated private-sector expansion, while the University of Michigan consumer-sentiment index fell to 48.1. Softer end-of-week data would further support a Fed pause, but continued strength could revive expectations of tightening in December.
Central banks continue gold accumulation as the WGC reports 39 tonnes of net purchases in August; China extends its streak to 22 months
The World Gold Council reported that global central banks’ net gold purchases reached 39 tonnes in August, lifting cumulative purchases in the first 8 months of 2026 to 170 tonnes. The People’s Bank of China added 20 tonnes, extending its buying streak to 22 months, while Poland and Uzbekistan each added 8 tonnes, reflecting planned long-term reserve accumulation.
Central-bank gold accumulation reflects reserve diversification and reduced reliance on the dollar amid global public-debt concerns. Because gold carries no counterparty risk, this continued buying provides a structural base that helps prevent a deep correction.



Technical Analysis of Gold (XAU/USD)
On the 1-hour chart, gold has recovered in a V-shaped move after forming a base at $4,064–4,074. Price structure has begun to form successive higher lows and is now testing first resistance at $4,185–4,195, a prior supply zone where selling was previously concentrated.
The RSI recovered from the oversold level of 20 to move above 50 and is now around 55–58, indicating that buyers have regained the advantage. But approaching resistance could bring intermittent profit-taking selling.
The pivotal level is resistance at $4,185–4,195. Holding above $4,195 would successfully reclaim the structure; failure to do so would risk a bull trap.
If prices hold above support at $4,141–4,150 and break through resistance at $4,185–4,195, they could recover toward $4,215–4,227 and $4,276–4,289. But if they break below first support, they risk testing the next support levels at $4,104–4,113 and $4,064–4,074.
Today's Gold Price Outlook
| Scenarios |
|
|
|
Today's Trading Strategy
Short-term traders should trade the range cautiously, watch the response around key support and resistance levels, and avoid chasing prices below resistance at $4,185–4,195.
- Buy setup: Consider a pullback to the $4,141–4,150 support zone if buying pushes prices back up, or follow a break above $4,195, targeting $4,215–4,227 with a stop-loss below $4,130.
- Sell setup: Consider a position if prices rebound to test resistance at $4,185–4,195 or $4,215–4,227 and fail, or on a break below $4,141, targeting $4,104–4,113 with a stop-loss above resistance.
For long-term investors, structural support from central-bank gold buying remains strong. Consider gradually accumulating only after a pullback establishes a base above major support at $4,104 or $4,064.
Daily Support and Resistance Levels
| Type | Price Level |
| Support #1 | $4,141–4,150 |
| Support #2 | $4,104–4,113 |
| Support #3 | $4,064–4,074 |
| Resistance #1 | $4,185–4,195 |
| Resistance #2 | $4,215–4,227 |
| Resistance #3 | $4,276–4,289 |
Today's Questions (FAQ)
How does an 83% probability of a Fed pause in October support gold?
A pause in rate increases helps limit dollar appreciation and eases pressure on Treasury yields, reducing the opportunity cost of holding gold. That gives investors more confidence to return to speculation in precious metals, although markets must still watch inflation from oil prices.
Why does central-bank gold buying help support gold prices over the long term?
Central banks hold gold to diversify reserves and reduce reliance on the dollar. Their long-term accumulation is not sold in response to short-term volatility, so continued net purchases absorb liquidity and create a stable price base that helps prevent gold from falling deeply.
Read more
The above content was completed with the assistance of AI and has been reviewed by an editor.


