


Gold retests $4,200 as dollar and yields retreat — can bullion clear its hardest level?


Mitrade Insights — Gold is back at the door it has failed to kick open. Spot bullion traded near $4,175 on Monday (+0.23%), with an intraday high of $4,187.71, after last week's $4,073 ~ $4,217 range; COMEX futures briefly topped $4,200 before fading. The immediate tailwind is familiar: the dollar slipped to 101.76 and 10-year Treasury yields eased from their highs. The obstacle is equally familiar: US inflation is still hot, October Fed hike odds sit near 52%, and Bank of America still expects gold below $4,000 within three months. So which side wins at $4,200?
1. The move: a quieter dollar, a stubborn ceiling
Monday's bid is a dollar story first. The US Dollar Index closed Friday at 101.76 (-0.21%), and the 10-year yield held near 5.1% after backing off the prior week's spike. Lower nominal yields, with inflation expectations still elevated, trim the real-yield headwind that has capped gold since September.
But the move is modest, and the reason is simple: the same inflation data that lifted gold also lifted hike odds. US September CPI ran at 3.7% year on year, with core at 2.6%; producer prices accelerated. Markets now assign roughly a 52% probability to a hike at the October 27–28 FOMC meeting — up from about 22% earlier. Gold is climbing a wall of higher rates, not sailing through a vacuum.
2. The bull case and the bear case
| The bull case | The bear case |
|---|---|
| Middle East shipping and energy-infrastructure risks keep a geopolitical premium in the price | September CPI at 3.7% and accelerating PPI keep the inflation path hot |
| Central-bank buying remains a structural floor under the market | October hike odds near 52%; 10-year yields still above 5% |
| The dollar has rolled over from its highs and real yields are easing | $4,200 has rejected price repeatedly; the level is now a clear technical ceiling |
| The $4,073 October low has held, keeping the range intact | WGC data shows Turkey (-82t) and Russia (-56t) sold through August — official demand is not one-way |
The bull case is about the floor; the bear case is about the ceiling. Neither has decisively won, which is exactly why gold has spent two weeks boxed between $4,073 and $4,200.
3. The levels that matter
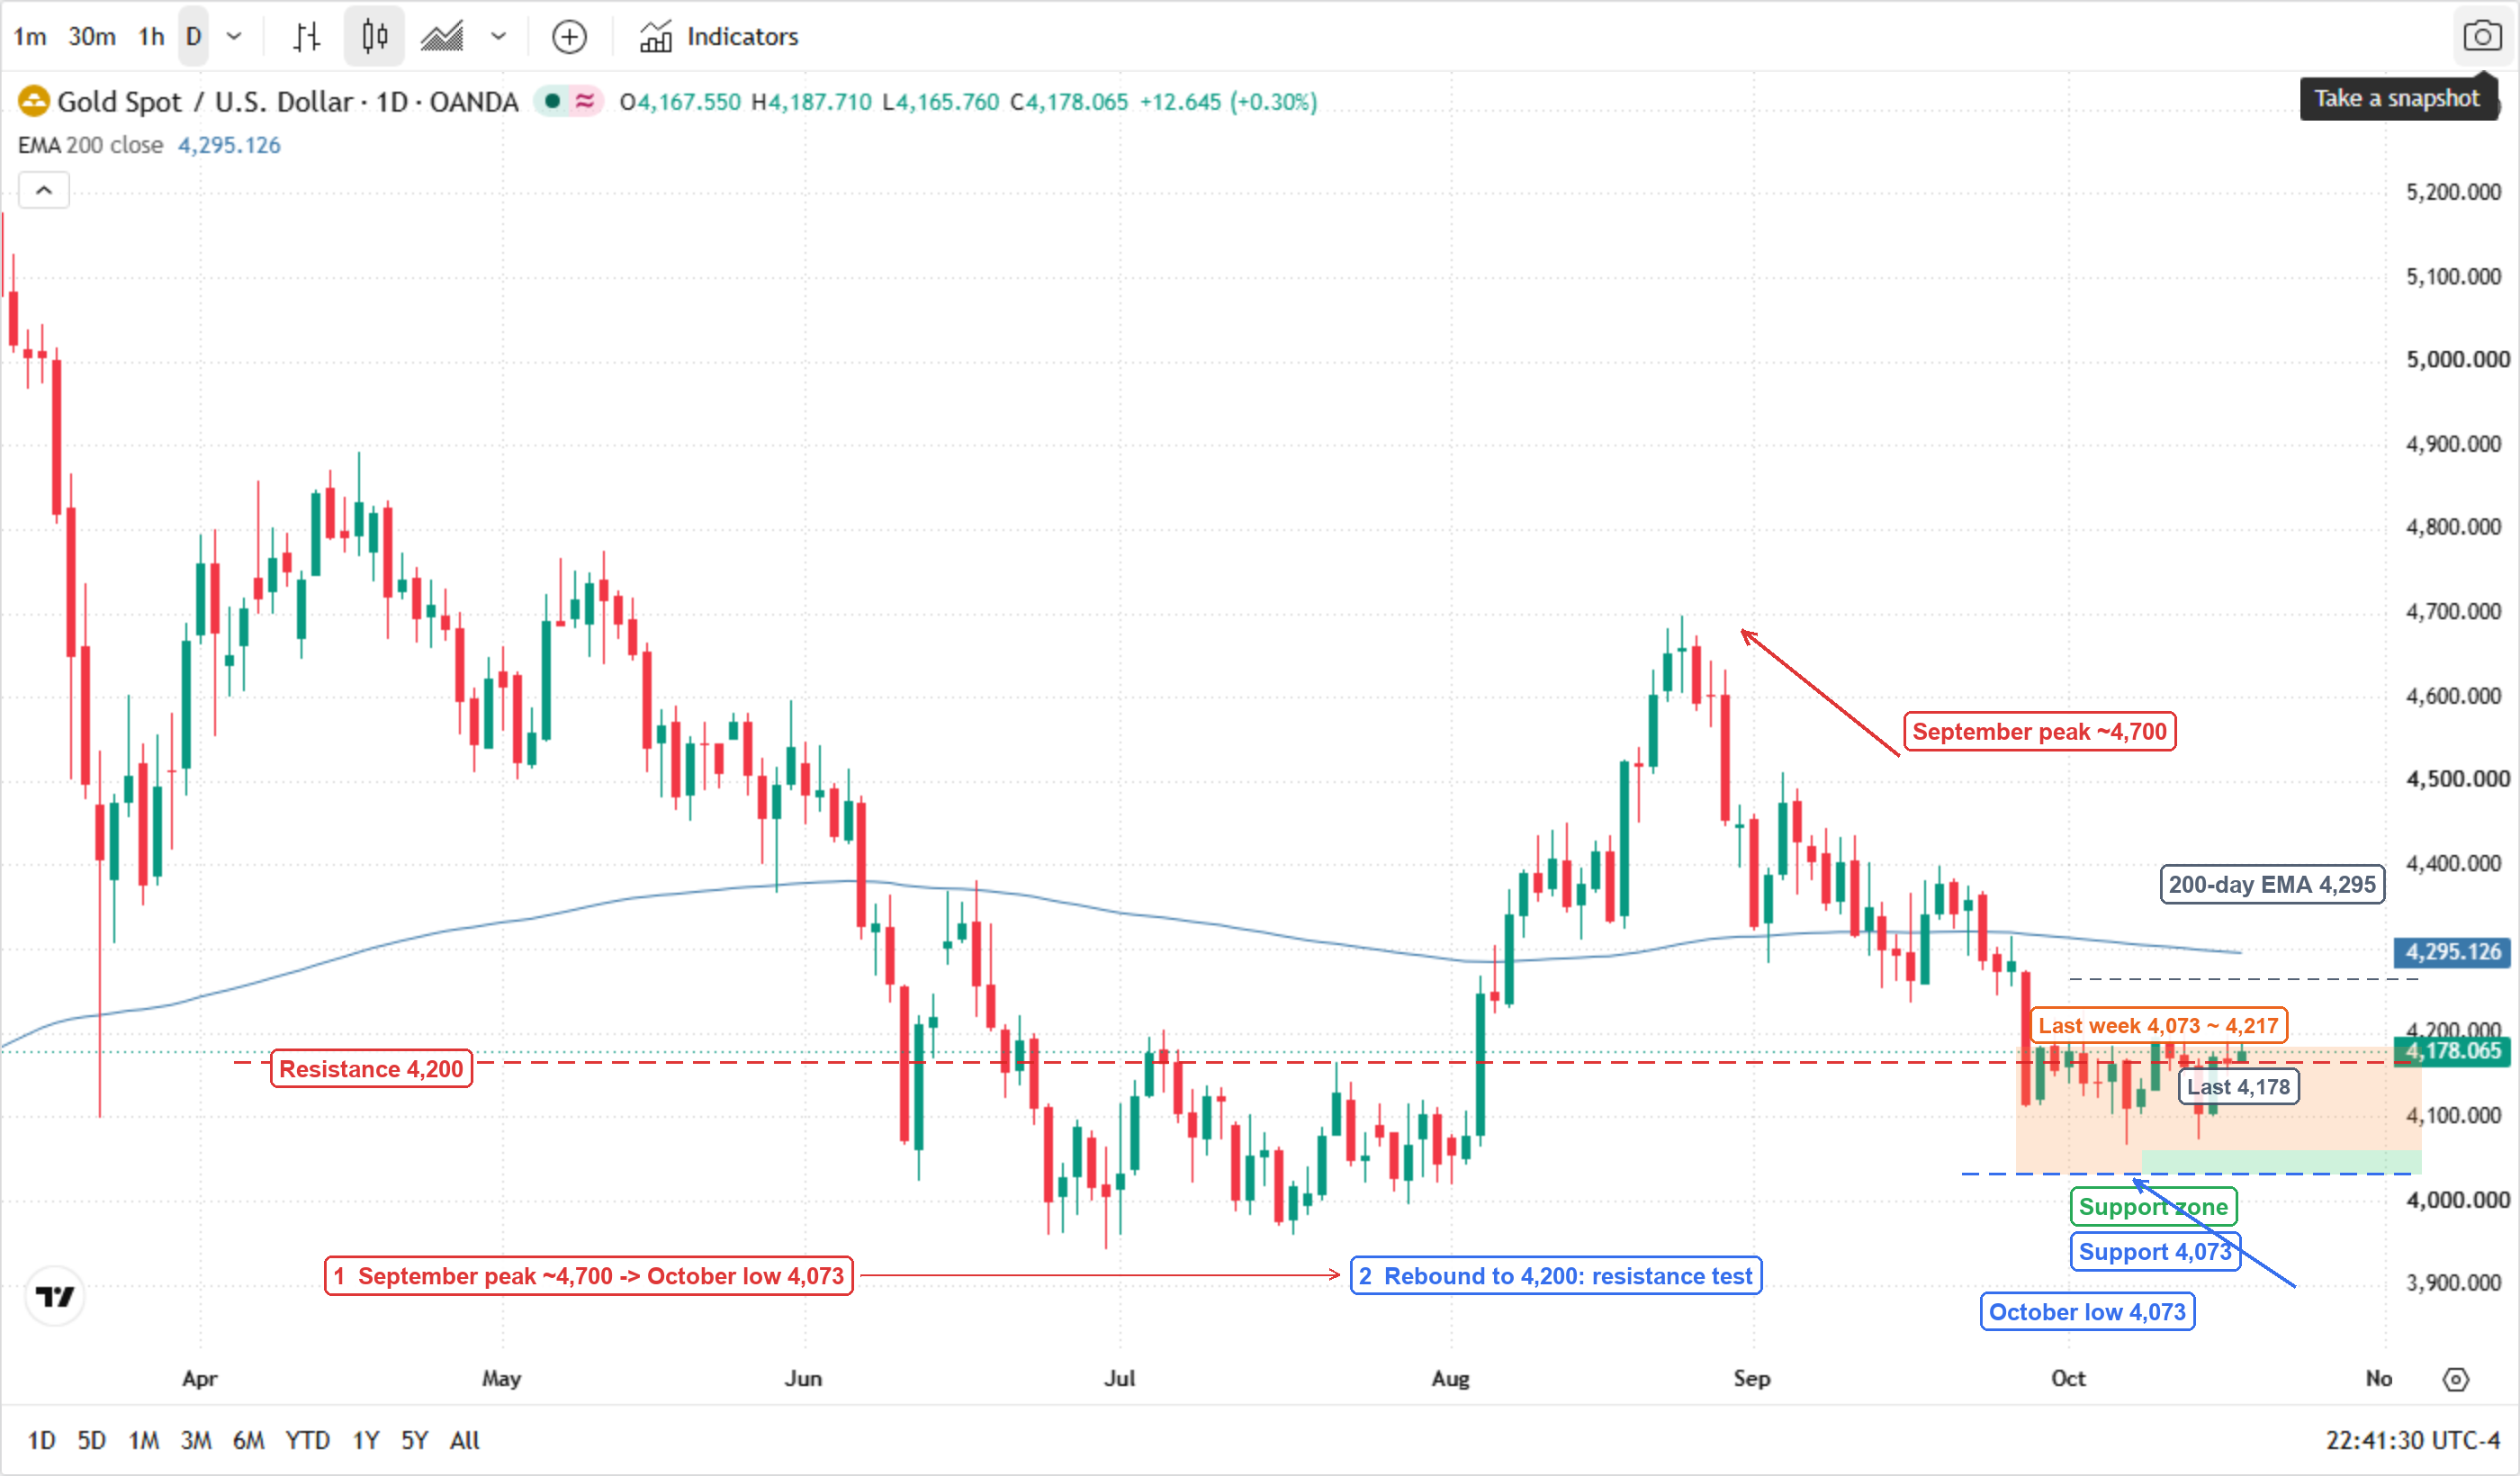
* Chart source: TradingView official chart screenshot, data source OANDA (spot gold / XAUUSD).
Watch $4,200 first: a daily close above it would turn the ceiling into support and open the 200-day EMA at $4,295.097 — the line that has capped every rebound since September. Below, $4,073 is the October floor and the bottom of last week's range; a break there exposes the $4,000 psychological zone and BofA's $3,950 reference.
4. What would flip the script
A daily close above $4,200. The first evidence that the two-week ceiling is breaking rather than holding; the 200-day EMA at $4,295 becomes the next test.
A daily close below $4,073. The range breaks downward and the $4,000 zone — where BofA sees the next stop — comes into play.
A sustained drop in the dollar below 101. Every durable gold rally this year has started with a softer dollar and lower long-end yields; a one-day dip has not been enough.
The next World Gold Council update showing official-sector flows turning net-positive. If central banks resume buying in size, the structural floor under the bear case gets thicker.
Bottom line: gold is doing two things at once — pricing a geopolitical premium, and paying for it with a higher real-yield discount. Until $4,200 or $4,073 breaks on a daily close, the market is paying traders to wait, not to chase.
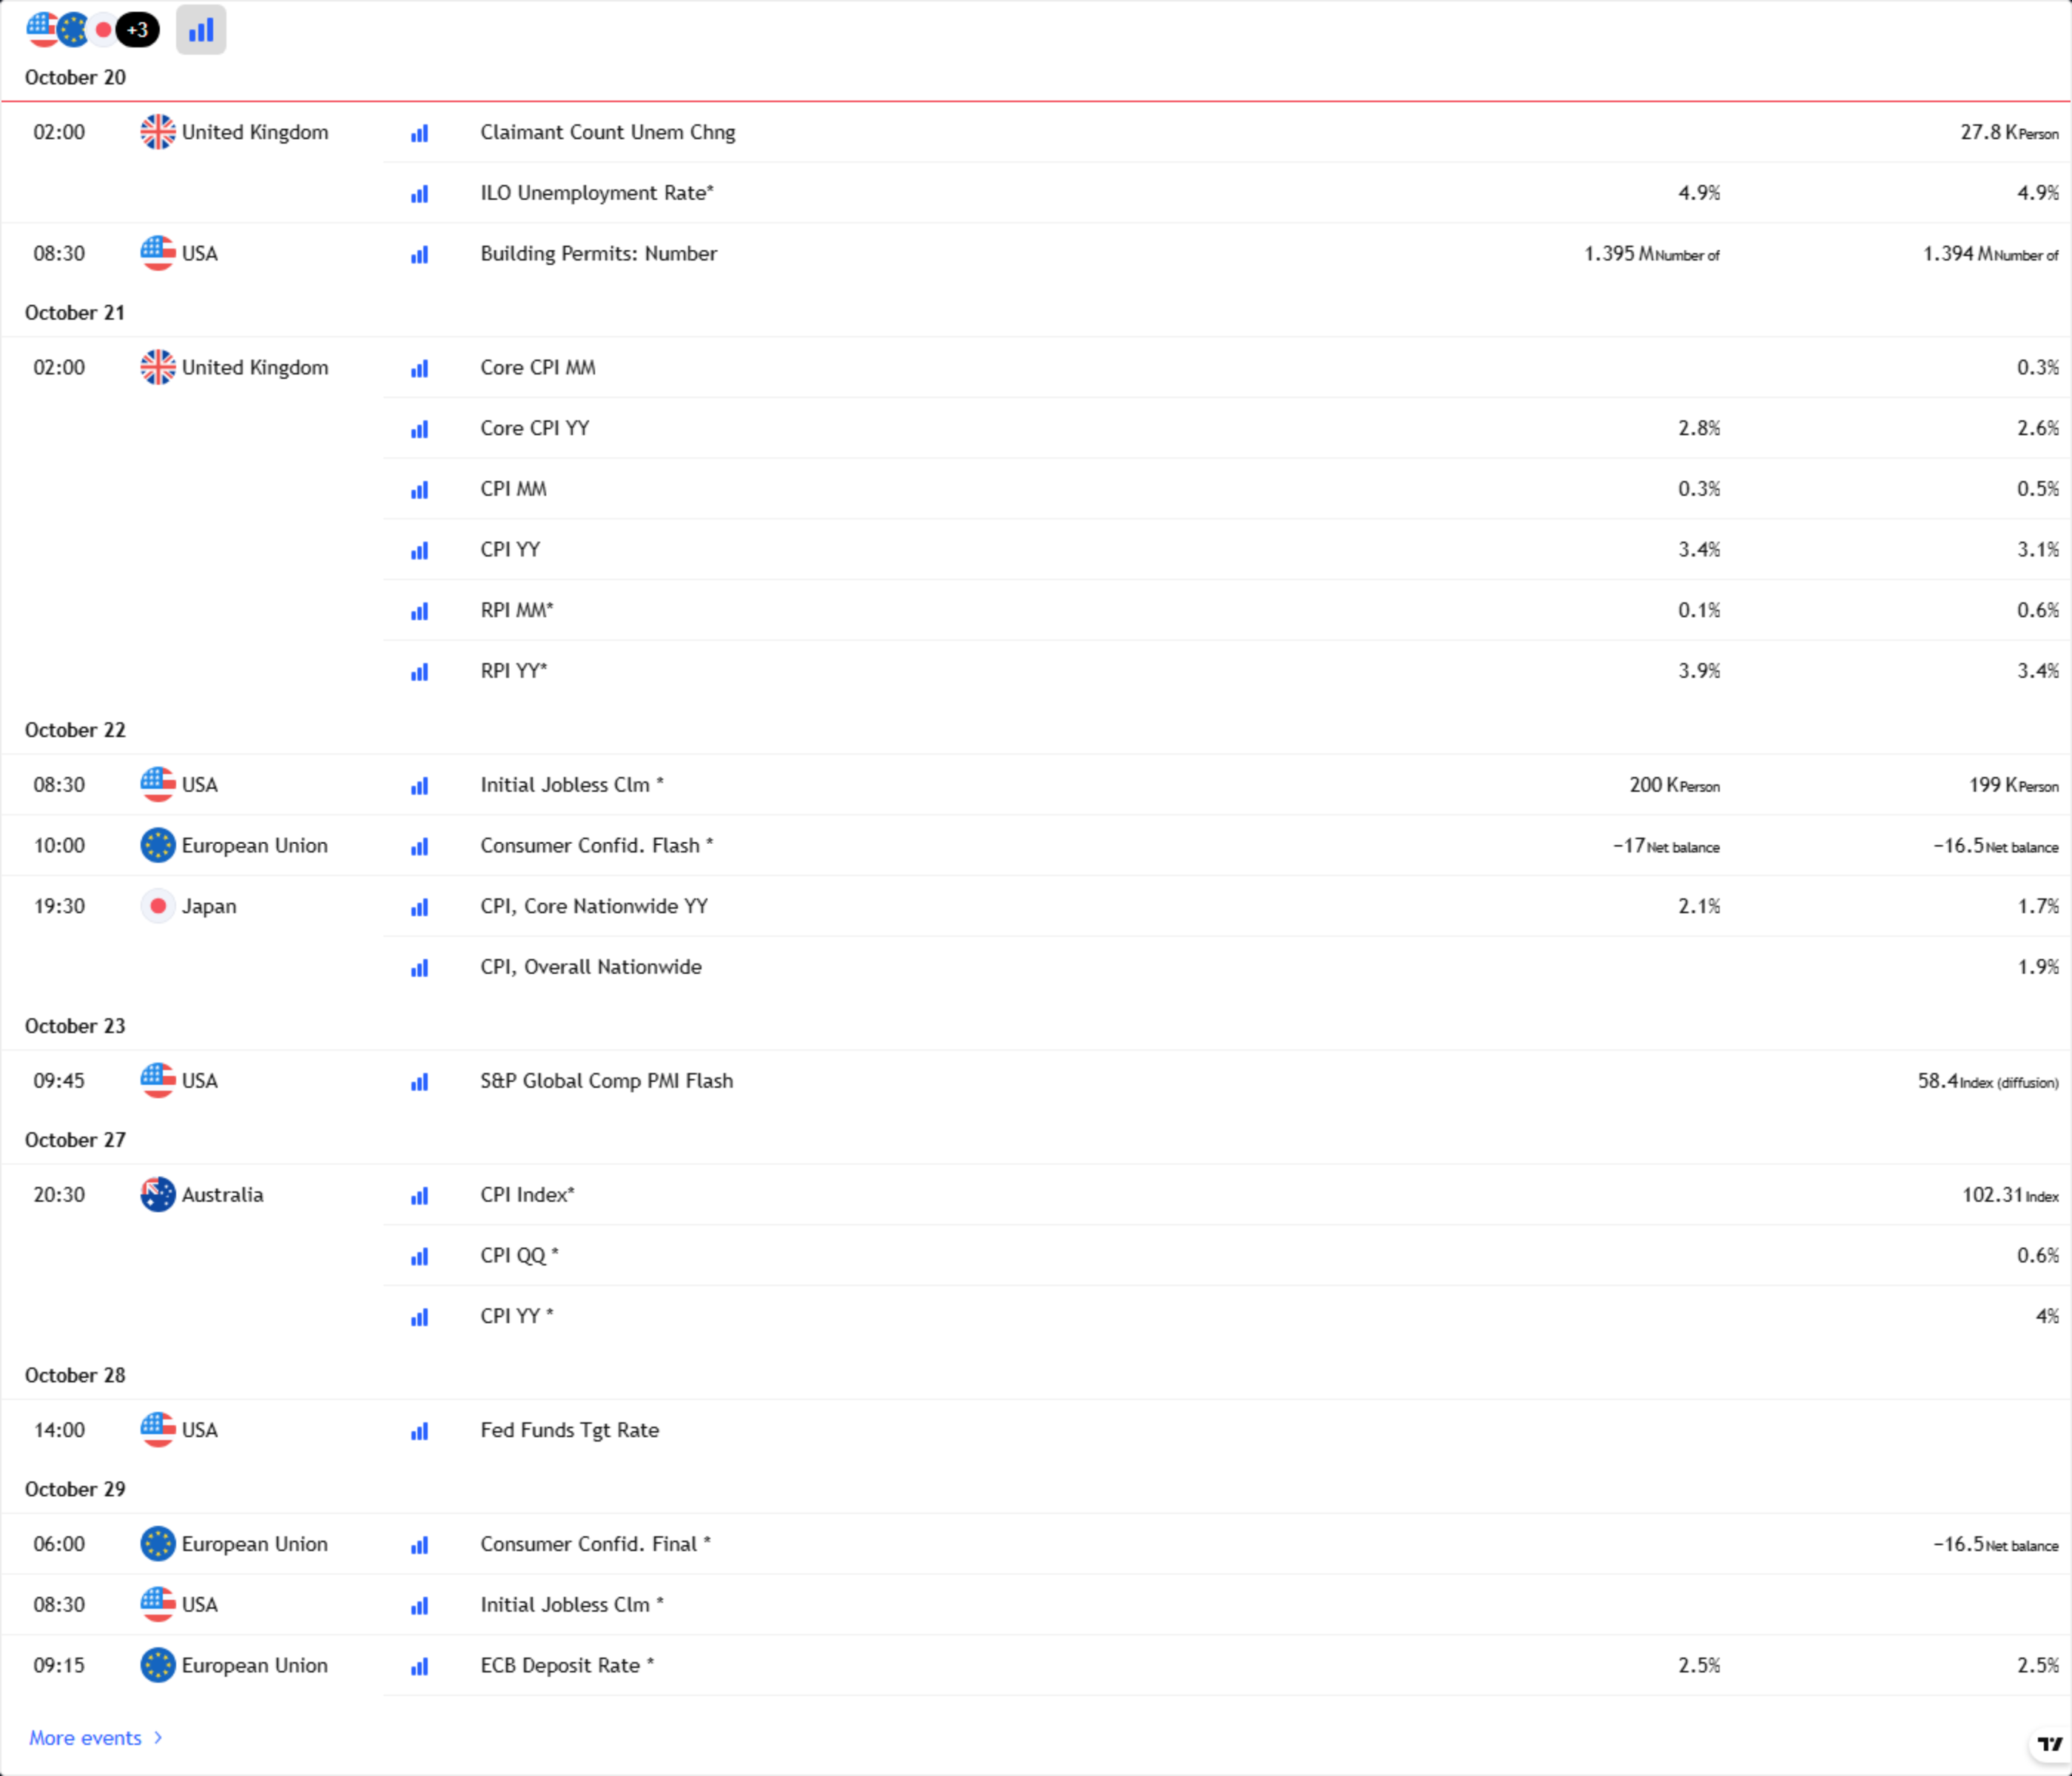
* Chart source: TradingView official economic calendar widget screenshot.
Related reads: Gold defends $4,100 as BofA targets a break below $4,000 — why the Middle East bid is missing
Read more
Before making any trading decisions, it is important to equip yourself with sufficient fundamental knowledge, have a comprehensive understanding of market trends, be aware of risks and hidden costs, carefully consider investment targets, level of experience, risk appetite, and seek professional advice if necessary.
Furthermore, the content of this article is solely the author's personal opinion and does not necessarily constitute investment advice. The content of this article is for reference purposes only, and readers should not use this article as a basis for any investment decisions.
Investors should not rely on this information as a substitute for independent judgment or make decisions solely based on this information. It does not constitute any trading activity and does not guarantee any profits in trading.
If you have any inquiries regarding the data, information, or content related to Mitrade in this article, please contact us via email: insights@mitrade.com. The Mitrade team will carefully review the content to continue improving the quality of the article.


