


Gold Price Analysis Today | Forex Gold Analysis | XAU/USD Analysis - October 20, 2026


Today's Gold Price
Gold price chart for today
*0% Commission and Low Spreads 0️⃣
*$50,000 in Free Virtual Funds 💰
*$100 New Customer Bonus 🎁
Gold (XAU/USD) traded around $4,138 on the morning of October 20, 2026, after selling pressure pushed it below minor resistance at $4,150–4,159 amid a stronger dollar and a surge in the U.S. 10-year Treasury yield to 5.14%. Markets still place nearly a 90% probability on a Fed rate increase in December. While the Hormuz crisis has kept Brent crude above $109 and Metals Focus sees a strong base at $4,000, the key question is whether gold can hold above support at $4,104–4,113 to build a recovery base.
Today's Key Points
| Key Points |
|
|
|
Stronger dollar and 10-year Treasury yield at 5.14% pressure gold; markets watch inflation and Fed rates in December
Spot gold came under pressure, falling to around $4,138.54 per ounce, down more than $26 overnight, as the dollar strengthened and the U.S. 10-year Treasury yield rose to 5.14%. U.S. economic data remained strong, led by a 0.8% increase in September retail sales and a 6.3% jump in the PPI, indicating that economic activity remains resilient despite high borrowing costs.
Although derivatives markets expect the Fed to pause rate increases at the October 27–28 meeting, they now place nearly a 90% probability on a Fed rate increase in December if inflation remains sticky. Yields above 5% have raised the opportunity cost of holding gold, while a recovery in technology stocks has drawn speculative funds away. This week, markets will watch U.S. housing starts and flash PMI data.
Strait of Hormuz crisis remains intense; Brent crude above $109 supports risk premium but keeps inflation elevated
Geopolitical uncertainty around the Strait of Hormuz remains a major vulnerability for energy markets after reports of renewed attacks on commercial vessels and the Houthis' claim of attacks on Saudi energy infrastructure. Although Trump eased sanctions on Russian energy to increase supply, shipping disruptions continue to constrain global crude availability.
The situation has kept Brent crude near $109.55 and WTI near $98.54 per barrel. The war-risk premium continues to support gold as a safe-haven asset and prevents a one-way decline. On the other hand, soaring energy costs are accelerating inflation and keeping bond yields elevated, limiting the scope for a recovery in gold prices.
Metals Focus sees a strong base for gold around $4,000, confident structural factors could open the way to $6,000 over the long term
Matthew Piggott of Metals Focus said this round of gold consolidation reflects competition for capital from other assets, such as equities and cryptocurrencies, rather than a loss of appeal. He said institutional investors and central banks continue to buy on every pullback toward $4,000 per ounce, creating a clearly strong structural support level.
Metals Focus forecasts average gold prices of $5,330 in 2027, with potential to rise to $6,000 if ETF inflows recover. Long-term structural support comes from U.S. public debt and the trend toward reducing reliance on the dollar.



Technical Analysis of Gold (XAU/USD)
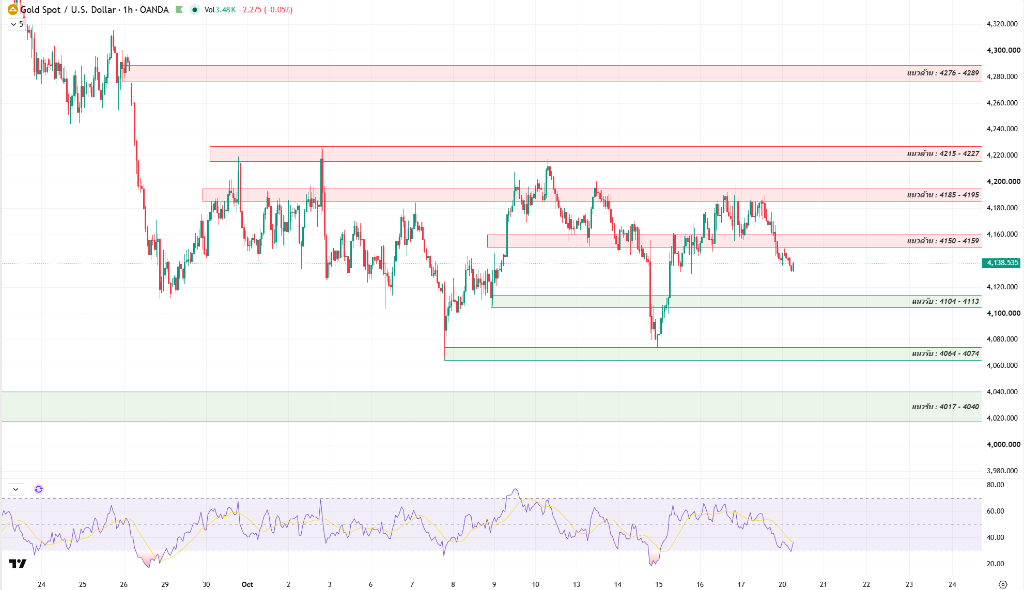
On the 1-hour chart, gold was sold below minor resistance at $4,150–4,159 after failing to clear $4,195. It last pulled back to around $4,138.54. The short-term structure has started to weaken and is testing first support at $4,104–4,113.
The RSI has fallen to around 30–35, near oversold territory, suggesting selling pressure has begun to ease and speculative buying may start to emerge. But price remains below the moving-average cluster, so a clear base is still needed.
The key decision point is support at $4,104–4,113. Holding there and reclaiming $4,150–4,159 would open the way to a recovery, while a break below would risk follow-through selling.
If prices hold above support at $4,104–4,113 and break through resistance at $4,150–4,159, they could recover toward $4,185–4,195. But if they break below first support, they risk a correction toward $4,064–4,074 and $4,017–4,040.
Today's Gold Price Outlook
| Scenarios |
|
|
|
Today's Trading Strategy
Short-term traders should trade the range cautiously, watch the response around key support and resistance levels, and avoid chasing short positions near support as the RSI starts to enter oversold territory.
- Buy setup: Consider a position if prices pull back to the $4,104–4,113 support zone and show clear buying support and easing selling pressure, or follow a break and hold above $4,159, targeting $4,185–4,195 with a stop-loss below $4,095.
- Sell setup: Consider a position if prices rebound to test resistance at $4,150–4,159 or $4,185–4,195 and fail, or on a break below $4,104, targeting $4,064–4,074 with a stop-loss above resistance.
For long-term investors, structural support remains strong because of U.S. debt issues. Consider gradually accumulating only after a pullback establishes a base above major support at $4,064 or $4,017–4,040.
Daily Support and Resistance Levels
| Type | Price Level |
| Support #1 | $4,104–4,113 |
| Support #2 | $4,064–4,074 |
| Support #3 | $4,017–4,040 |
| Resistance #1 | $4,150–4,159 |
| Resistance #2 | $4,185–4,195 |
| Resistance #3 | $4,215–4,227 |
Today's Questions (FAQ)
Why does a rise in the U.S. 10-year Treasury yield to 5.14% pressure gold prices?
Rising Treasury yields increase the opportunity cost of holding non-interest-bearing gold, prompting investors to shift funds toward fixed-income assets. The dollar's appreciation alongside higher Treasury yields therefore becomes a short-term headwind for gold.
What factors could push gold toward $6,000, as Metals Focus forecasts?
Metals Focus estimates that a recovery in gold ETF inflows, together with long-term structural factors such as U.S. debt, interest costs and the trend toward reducing reliance on the dollar, would attract investment back into the gold market.
Read more
The above content was completed with the assistance of AI and has been reviewed by an editor.


