

Ethereum reclaims $2,400 as PPI hits 6.3% and yields fall

Source Fxstreet
  • Ethereum reclaims $2,400 after an earlier US PPI inflation shock briefly pushed its price near $2,320
  • The recovery follows the US 10Y Treasury Yield falling to 5.095%, its lowest level since September 22.
  • ETH bounced off the 100-day EMA and the $2,355 horizontal level convergence.

Ethereum (ETH) is back above $2,400 on Thursday, rebounding from a brief decline toward $2,340, which was sparked by an upside surprise in the US wholesale inflation report.

The Producer Price Index (PPI) increased 1.3% monthly and 6.3% annually in September, far above expectations of 0.5% and 5.3%, respectively. Core PPI, which omits volatile energy and food prices, rose 0.7% MoM and 5% YoY, also above market forecasts of 0.3% and 4.4%, respectively.

The hot PPI print came in a day after the Consumer Price Index (CPI) also accelerated past market estimates, triggering selloffs across risk assets.

The PPI inflation reading follows nearly $1 billion in crypto liquidations over the past 24 hours. Ethereum accounts for most of that figure, as a brief decline to $2,340 triggered roughly $286 million in liquidations, with longs making up 84%.

ETH recovers on falling Treasury yields

However, the top altcoin has joined the wider crypto market in staging a comeback, reclaiming $2,400.

The recovery follows a pullback in US 10-year Treasury yields, which fell to 5.095% on Thursday, their lowest level since September 22. Yields had surged earlier in the week, but worries about heavy AI-related spending led some investors to rotate out of AI-linked stocks and into Treasuries. That buying pushed Treasury prices up and yields down, easing pressure on risk assets like Ethereum.

The US Dollar Index (DXY), which measures the Greenback against six major fiat currencies, also erased its earlier post-CPI gains, dropping to 102.04 at the time of writing.

Meanwhile, on the institutional front, US spot ETH exchange-traded funds returned to net selling on Wednesday, recording nearly $130 million in net outflows, outweighing Tuesday's modest $24.8 million inflow, per SoSoValue data. The products have posted outflows in 11 out of the last 12 trading days.
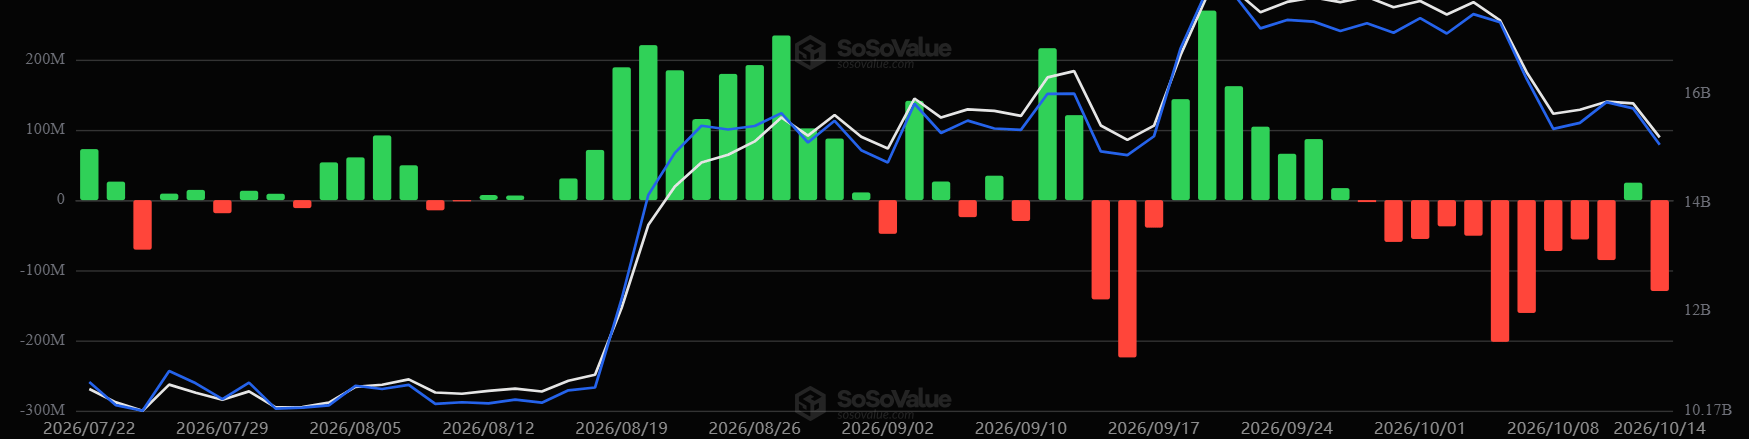
US spot ETH ETFs. Source: SoSoValue

Ethereum technical outlook: ETH bounces off 100-day EMA

On the daily chart, ETH bounced off the 100-day Exponential Moving Average (EMA) at $2,356 and the $2,355 horizontal level confluence. The top altcoin is looking to hold the recovery above the $2,411 level.

​The slight rise in the Relative Strength Index (RSI) to 40.9 and a Stochastic reading near 25 suggest modest cooling of immediate bearish conditions.

On the topside, initial resistance is located at the 50-day EMA at $2,496, followed by the nearby horizontal barrier at $2,548 and the 20-day EMA at $2,552, forming a tight cluster that ETH must reclaim to stabilize the short-term outlook.

Chart Analysis ETH/USDT (Binance)
ETH/USDT daily chart

On the downside, immediate support is seen at the 100-day EMA and the adjacent horizontal level at $2,355. A daily close below this area would expose the next floors at $2,204, then $1,971 and $1,827.

(The technical analysis of this story was written with the help of an AI tool. Know more.)

Disclaimer: For information purposes only. Past performance is not indicative of future results.
placeholder
October hike odds climb toward 60% as Goldman and BofA both flip — what Warsh's "dose of accommodation" really changedRate futures now price roughly 55% to 62% for a 25bp hike at the October 27-28 FOMC, up from about 30% before Chair Warsh's post-meeting framing that the Fed is merely "removing some accommodation." Goldman Sachs has added an October hike to its forecast and Bank of America now sees moves in both October and December. Here is the repricing, the language behind it, and the two data points that decide it.
Author  Irene Q.
Sep 23, Wed
Rate futures now price roughly 55% to 62% for a 25bp hike at the October 27-28 FOMC, up from about 30% before Chair Warsh's post-meeting framing that the Fed is merely "removing some accommodation." Goldman Sachs has added an October hike to its forecast and Bank of America now sees moves in both October and December. Here is the repricing, the language behind it, and the two data points that decide it.
placeholder
Strong profits, falling shares: bank earnings day one meets a memory-chip rout — with CPI and ASML aheadGoldman Sachs blew past estimates (EPS $17.01 vs $13.09 expected, profit +33%) while JPMorgan missed ($5.75 vs $5.93) and Wells Fargo fell 3% — yet the S&P 500 finished flat at 7,805.45, pinned below its record close as a memory-chip rout (SOX −2.67%, Micron under $1,000) kept the pressure on. Tonight brings the week's decider: US September CPI at 8:30 ET, then Bank of America, Morgan Stanley, BlackRock and ASML before the open. Here are the levels, both cases, and the watch list.
Author  Irene Q.
Oct 14, Wed
Goldman Sachs blew past estimates (EPS $17.01 vs $13.09 expected, profit +33%) while JPMorgan missed ($5.75 vs $5.93) and Wells Fargo fell 3% — yet the S&P 500 finished flat at 7,805.45, pinned below its record close as a memory-chip rout (SOX −2.67%, Micron under $1,000) kept the pressure on. Tonight brings the week's decider: US September CPI at 8:30 ET, then Bank of America, Morgan Stanley, BlackRock and ASML before the open. Here are the levels, both cases, and the watch list.
placeholder
US September CPI recap: inflation hits 3.7% as core runs hot — is an October Fed hike back on the table?September CPI landed hot: headline 3.7% y/y, core 2.6% y/y and 0.3% m/m. October hike odds jumped from ~22% to ~37% — yet the dollar faded to 101.74, gold closed higher and the S&P 500 fell 1.11%. Here is the full repricing, the levels and what to watch next.
Author  Irene Q.
23 hours ago
September CPI landed hot: headline 3.7% y/y, core 2.6% y/y and 0.3% m/m. October hike odds jumped from ~22% to ~37% — yet the dollar faded to 101.74, gold closed higher and the S&P 500 fell 1.11%. Here is the full repricing, the levels and what to watch next.
placeholder
Gold defends $4,100 as BofA targets a break below $4,000 — why the Middle East bid is missingSpot gold flushed to $4,099.89, a whisker above October's $4,090 low, then rebounded to close at $4,138.25 (+0.82%) — even as US CPI ran hot. Bank of America sees gold below $4,000 within three months, citing shrinking demand and official-sector selling. Here are the levels, the drivers and what would flip the script.
Author  Irene Q.
22 hours ago
Spot gold flushed to $4,099.89, a whisker above October's $4,090 low, then rebounded to close at $4,138.25 (+0.82%) — even as US CPI ran hot. Bank of America sees gold below $4,000 within three months, citing shrinking demand and official-sector selling. Here are the levels, the drivers and what would flip the script.
placeholder
Gold Price Analysis Today | Forex Gold Analysis | XAU/USD Analysis - October 15, 2026Get the latest gold price analysis, forex gold insights, and XAU/USD analysis for October 15, 2026. Read on for the details.
Author  Mitrade
22 hours ago
Get the latest gold price analysis, forex gold insights, and XAU/USD analysis for October 15, 2026. Read on for the details.
Related Instrument
goTop
quote