

Silver Price Falls Below $50 to Hit Near One-Year Low: Why Is Silver Falling?

Source Tradingkey

TradingKey - As of the Asian session on Monday (November 16), silver prices (XAGUSD) extended their recent decline, falling for the third consecutive trading day and dropping nearly 3% intraday to trade near $47.40, hitting a fresh low in nearly a year. Silver fell 6.18% cumulatively last week, losing the key $50 psychological level, as mounting expectations of further Fed rate hikes drove the U.S. dollar and Treasury yields higher, keeping silver prices under sustained pressure.

The recent sustained decline in silver has been primarily driven by U.S. inflation pressures and shifting expectations for Federal Reserve monetary policy. U.S. October CPI rose 0.4% month-over-month, higher than market expectations of 0.3%. Although the newly released October PPI rose only 0.3% month-over-month, below the expected 0.4%, its year-over-year increase still reached 6.5%, indicating that producer-level inflation pressures remain elevated. Fed officials have also continued to deliver hawkish signals, with Kansas City Fed President Schmid stating that inflation remains too high. According to the CME FedWatch tool, the market prices in an approximately 90.8% probability of a 25-basis-point rate hike by the Fed in December and an approximately 9.2% probability of a 50-basis-point hike, reflecting strong expectations for further monetary policy tightening.

Driven by this, the U.S. dollar remained near its highest level since April 2025, and the 10-year U.S. Treasury yield climbed back above 5%, briefly touching near 5.16% last week. A stronger dollar raises the cost of silver for non-dollar investors, while higher Treasury yields, especially real yields, increase the opportunity cost of holding non-yielding silver.
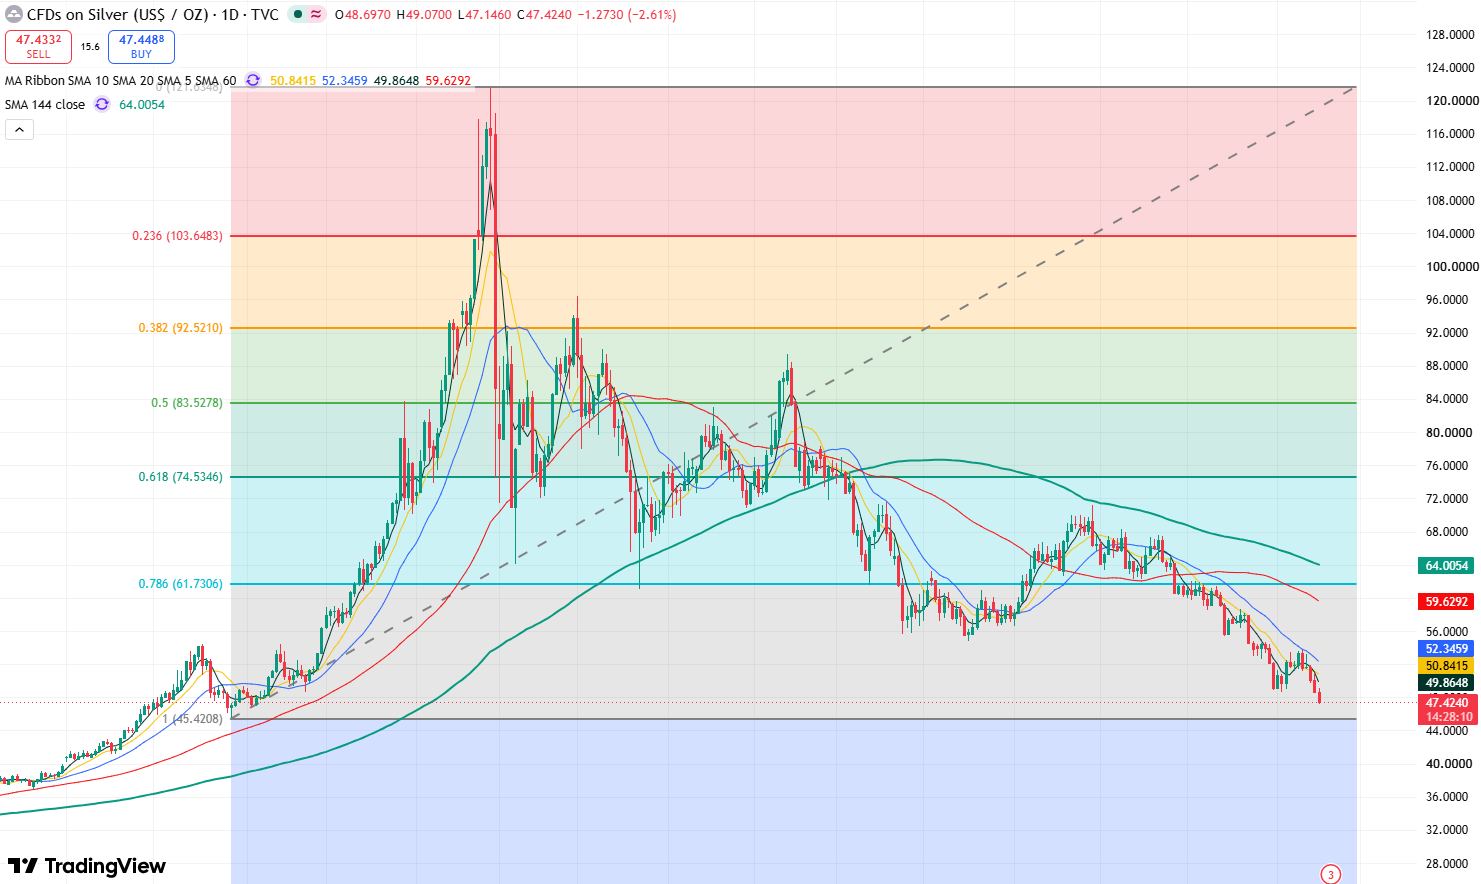
xag-c1a0e291082240b7ba54b02a865c09ea

Silver price daily chart, Source: TradingView

From the daily chart of silver, as the highs and lows of the candlestick pattern continue to shift downward, and after silver broke below the November 3 low of $48.61 last week, further downside room has opened up, indicating that the short-term downtrend remains intact.

In terms of technical indicators, the Relative Strength Index (RSI) stands at 30.25, approaching oversold territory, which indicates heavy short-term selling pressure, though a technical rebound is also possible after consecutive declines. However, an oversold condition does not mean the downtrend has ended until prices break back above short-term moving averages.

At present, silver prices may continue to decline in the short term. The primary downside target will be to test the support level near $45. If this level is lost, silver will pull back further toward the $40 mark.

To the upside, the primary resistance to watch is the $48–$48.8 area. If silver breaks above this level, the next resistance to monitor is near $50. Only when silver firmly regains ground above $50 will short-term downward pressure be significantly alleviated.

Disclaimer: For information purposes only. Past performance is not indicative of future results.
placeholder
Nvidia slid 7.7% after hours while AMD and Broadcom rose — the AI trade changed hands, it didn't breakNvidia closed Wednesday at 173.73, up 2.87%, then fell as much as 8.1% to 159.44 after reports that its board was preparing for a possible leadership change. The same session, the Philadelphia Semiconductor Index rose 5.7% with all 30 components higher, CoreWeave jumped 24.7% on 168% revenue growth, and Micron added 11.9%. If AI demand were being repriced, AMD and Broadcom would not be bid. This is a governance discount on one name, and 204.54 — the 200-day average — is the level that settles it.
Author  Irene Q.
Nov 12, Thu
Nvidia closed Wednesday at 173.73, up 2.87%, then fell as much as 8.1% to 159.44 after reports that its board was preparing for a possible leadership change. The same session, the Philadelphia Semiconductor Index rose 5.7% with all 30 components higher, CoreWeave jumped 24.7% on 168% revenue growth, and Micron added 11.9%. If AI demand were being repriced, AMD and Broadcom would not be bid. This is a governance discount on one name, and 204.54 — the 200-day average — is the level that settles it.
placeholder
Gold hit a one-year low while central banks bought 321 tonnes — the sellers were never the ones you thinkSpot gold closed at 3,876 on Thursday, down 2.8% and its lowest close in more than a year, with an intraday low near 3,852. The dollar is at a 19-month high of 103.21 and the 10-year yield is at 5.10%, so the price move is easy to explain. What is harder to explain is who sold: central banks bought 321 tonnes in Q3, the PBoC added for a 24th straight month, ETF holdings are near a record 4,256 tonnes, and roughly 95% of the futures selling came from non-reportable and sovereign-type accounts rather than hedge funds. This piece separates the two books that have to balance.
Author  Irene Q.
Nov 13, Fri
Spot gold closed at 3,876 on Thursday, down 2.8% and its lowest close in more than a year, with an intraday low near 3,852. The dollar is at a 19-month high of 103.21 and the 10-year yield is at 5.10%, so the price move is easy to explain. What is harder to explain is who sold: central banks bought 321 tonnes in Q3, the PBoC added for a 24th straight month, ETF holdings are near a record 4,256 tonnes, and roughly 95% of the futures selling came from non-reportable and sovereign-type accounts rather than hedge funds. This piece separates the two books that have to balance.
placeholder
Brent rose 3.3% and US crude stocks built 4.66 million barrels in the same weekBrent January settled at 95.82, up 3.3%, and WTI at 88.74, up 2.55%, after the US signalled it would not pursue a deal with Iran and attacks on Gulf shipping continued. In the same week, EIA data showed US crude inventories rising 4.657 million barrels against expectations of a 1.1 million draw, with gasoline up another 1.799 million. OPEC output also rebounded 1.96 million barrels a day to 27.16 million in October, led by Saudi Arabia at 10.56 million. This piece separates the geopolitical premium from the physical balance and lays out where each side of the trade is anchored.
Author  Irene Q.
Nov 13, Fri
Brent January settled at 95.82, up 3.3%, and WTI at 88.74, up 2.55%, after the US signalled it would not pursue a deal with Iran and attacks on Gulf shipping continued. In the same week, EIA data showed US crude inventories rising 4.657 million barrels against expectations of a 1.1 million draw, with gasoline up another 1.799 million. OPEC output also rebounded 1.96 million barrels a day to 27.16 million in October, led by Saudi Arabia at 10.56 million. This piece separates the geopolitical premium from the physical balance and lays out where each side of the trade is anchored.
placeholder
Anthropic is six times oversubscribed at $1.4 trillion while Nvidia is down 32% — the AI trade has two pricesAnthropic lists on Nasdaq as ANT on Thursday at $70 ~ $78 a share, raising up to $64.4 billion at a target valuation near $1.4 trillion, and the book is reportedly six times covered. In the same six weeks, Nvidia has fallen 32% and the QQQ is 10.9% below its October peak. Private capital and public markets are marking the same AI complex at two very different prices. This piece separates the two books: what the S-1 shows, who is anchoring the $26 billion private placement, and what Thursday's debut would have to do to change the public tape.
Author  Irene Q.
5 hours ago
Anthropic lists on Nasdaq as ANT on Thursday at $70 ~ $78 a share, raising up to $64.4 billion at a target valuation near $1.4 trillion, and the book is reportedly six times covered. In the same six weeks, Nvidia has fallen 32% and the QQQ is 10.9% below its October peak. Private capital and public markets are marking the same AI complex at two very different prices. This piece separates the two books: what the S-1 shows, who is anchoring the $26 billion private placement, and what Thursday's debut would have to do to change the public tape.
placeholder
Gold Price Analysis Today | Forex Gold Analysis | XAU/USD Analysis - November 16, 2026Get the latest gold price analysis, forex gold insights, and XAU/USD analysis for November 16, 2026. Read on for the details.
Author  Mitrade
5 hours ago
Get the latest gold price analysis, forex gold insights, and XAU/USD analysis for November 16, 2026. Read on for the details.
goTop
quote