


Gold struggles below $3,900 ahead of US PPI data
- Gold heads for a sharp weekly decline as aggressive Fed rate hike bets weigh on sentiment.
- Traders await US PPI data for fresh clues on inflation and the Fed's interest rate outlook.
- Technical indicators remain bearish, with RSI below 50 and MACD in negative territory.
Gold (XAU/USD) trims its gains on Friday after briefly climbing above $3,900.The metal fell to $3,852 on Thursday, its lowest level since October 2025. Hawkish remarks from Federal Reserve (Fed) officials have fueled bets on an extended period of monetary policy tightening, lifting the US Dollar (USD) and US Treasury yields and leaving the metal down more than 4% so far this week.
At the time of writing, XAU/USD is 0.40% up on the day at around $3,889. The focus now turns to US Producer Price Index (PPI) data at 13:30 GMT.
Dollar surges as Fed hike expectations drive short-end yields higher
Analysts at ING describe “a powerful, macro-driven rally in the dollar” this week, as markets rapidly reprice the Fed’s near-term path. They note that “short-dated US yields are close to 40bp higher since Tuesday morning, when the Fed's Christopher Waller mused over the need for a 50bp hike in December.” In the wake of those comments, ING highlights that “the market has since adopted the view that back-to-back December and January hikes look likely, while extending the full Fed adjustment from here to a full 85bp of tightening.”
The US Dollar Index (DXY), which tracks the Greenback against a basket of six major currencies, trades around 103.23 near a 19-month high and is on track for a third straight weekly gain. A stronger US Dollar makes Gold more expensive for buyers using other currencies, while higher US Treasury yields raise the opportunity cost of holding the non-yielding metal.
Fed officials warn that inflation remains too high
Earlier this week, US Consumer Price Index (CPI) data showed headline inflation rose 0.4% MoM in October, above the 0.3% forecast. Core CPI, which excludes food and energy, rose 0.3% MoM, exceeding the 0.2% forecast.
Dallas Fed President Lorie Logan said on Tuesday that the central bank needs “at least two more 25-basis-point rate increases” to bring inflation down.
On Thursday, Cleveland Fed President Beth Hammack said inflation pressures were “moving in the wrong direction” and that the Fed needed to “move to a restrictive stance of policy” to bring inflation back to 2%. San Francisco Fed President Mary Daly also said her “bias is that further tightening will be needed.”
Higher energy costs could keep inflation elevated as prospects for a deal to end the US-Iran war remain slim. West Texas Intermediate (WTI) crude jumped more than 3% on Thursday after US President Donald Trump said Washington did not need a deal with Iran to end the war.
Technical Analysis: Bearish bias persists below key daily SMAs
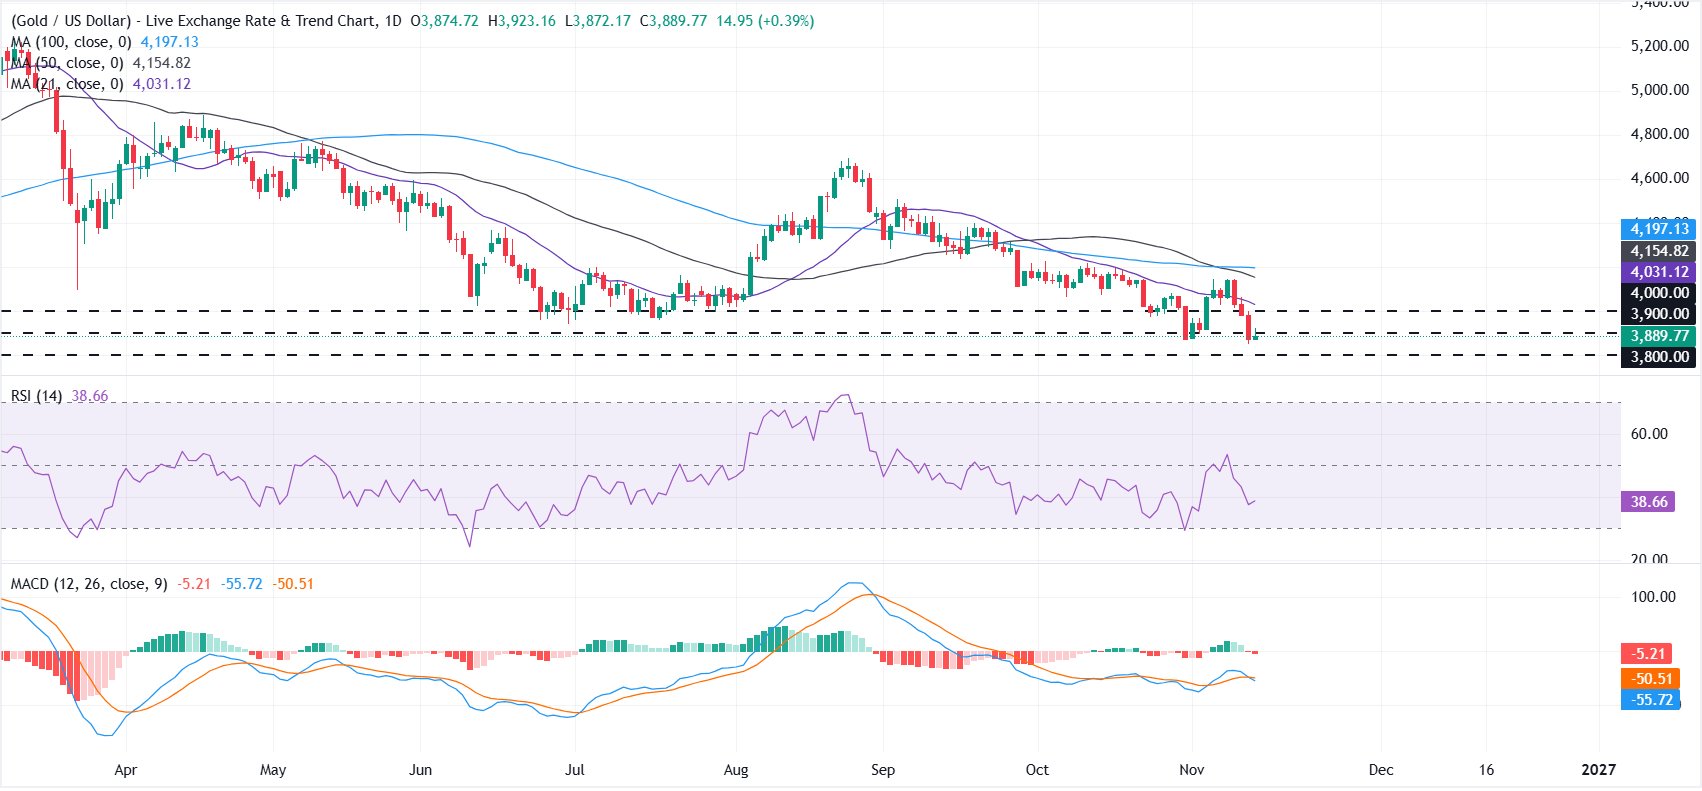
On the daily chart, XAU/USD is extending a bearish near-term bias as price holds below the 21-day, 50-day, and 100-day Simple Moving Averages (SMAs). The Relative Strength Index (RSI) at 38 stays below the midline, while the Moving Average Convergence Divergence (MACD) indicator is negative, both reinforcing a soft downside tone even as oversold conditions are not yet extreme.
On the topside, initial resistance emerges at the nearby horizontal barrier of $3,900, followed by the psychological $4,000 level, ahead of the 21-day SMA at $4,031, which caps any stronger recovery. Above there, the 50-day SMA at $4,154 and the 100-day SMA at $4,197 form a broader supply zone.
On the downside, Thursday’s low of $3,852 offers immediate support, followed by the $3,800 psychological level. A break below $3,800 could open the door to a deeper decline.
(The technical analysis of this story was written with the help of an AI tool. Know more.)
Gold FAQs
Gold has played a key role in human’s history as it has been widely used as a store of value and medium of exchange. Currently, apart from its shine and usage for jewelry, the precious metal is widely seen as a safe-haven asset, meaning that it is considered a good investment during turbulent times. Gold is also widely seen as a hedge against inflation and against depreciating currencies as it doesn’t rely on any specific issuer or government.
Central banks are the biggest Gold holders. In their aim to support their currencies in turbulent times, central banks tend to diversify their reserves and buy Gold to improve the perceived strength of the economy and the currency. High Gold reserves can be a source of trust for a country’s solvency. Central banks added 1,136 tonnes of Gold worth around $70 billion to their reserves in 2022, according to data from the World Gold Council. This is the highest yearly purchase since records began. Central banks from emerging economies such as China, India and Turkey are quickly increasing their Gold reserves.
Gold has an inverse correlation with the US Dollar and US Treasuries, which are both major reserve and safe-haven assets. When the Dollar depreciates, Gold tends to rise, enabling investors and central banks to diversify their assets in turbulent times. Gold is also inversely correlated with risk assets. A rally in the stock market tends to weaken Gold price, while sell-offs in riskier markets tend to favor the precious metal.
The price can move due to a wide range of factors. Geopolitical instability or fears of a deep recession can quickly make Gold price escalate due to its safe-haven status. As a yield-less asset, Gold tends to rise with lower interest rates, while higher cost of money usually weighs down on the yellow metal. Still, most moves depend on how the US Dollar (USD) behaves as the asset is priced in dollars (XAU/USD). A strong Dollar tends to keep the price of Gold controlled, whereas a weaker Dollar is likely to push Gold prices up.
Recommended Articles


