


USD/JPY Price Forecast: Remains close to 20-day EMA
- USD/JPY declines to near 157.90 as the US Dollar continues to underperform.
- The victory of US Democrats in midterm elections has jeopardized the continuations Republicans’ policies.
- Investors are confident that the Fed will hike interest rates in the December policy meeting.
The Japanese Yen (JPY) trades higher against the US Dollar (USD) on Thursday. In the European trade, the USD/JPY pair is down 0.3% to near 157.90. The pair faces selling pressure as the US Dollar underperforms due to fears that United States (US) Republicans would struggle to continue their policies after a setback in midterm elections against Democrats.
US Dollar Price Today
The table below shows the percentage change of US Dollar (USD) against listed major currencies today. US Dollar was the weakest against the New Zealand Dollar.
| USD | EUR | GBP | JPY | CAD | AUD | NZD | CHF | |
|---|---|---|---|---|---|---|---|---|
| USD | -0.29% | -0.16% | -0.32% | -0.12% | -0.17% | -0.41% | -0.33% | |
| EUR | 0.29% | 0.13% | -0.05% | 0.16% | 0.12% | -0.14% | -0.06% | |
| GBP | 0.16% | -0.13% | -0.17% | 0.03% | -0.01% | -0.25% | -0.19% | |
| JPY | 0.32% | 0.05% | 0.17% | 0.21% | 0.17% | -0.10% | -0.01% | |
| CAD | 0.12% | -0.16% | -0.03% | -0.21% | -0.04% | -0.30% | -0.22% | |
| AUD | 0.17% | -0.12% | 0.01% | -0.17% | 0.04% | -0.23% | -0.17% | |
| NZD | 0.41% | 0.14% | 0.25% | 0.10% | 0.30% | 0.23% | 0.10% | |
| CHF | 0.33% | 0.06% | 0.19% | 0.01% | 0.22% | 0.17% | -0.10% |
The heat map shows percentage changes of major currencies against each other. The base currency is picked from the left column, while the quote currency is picked from the top row. For example, if you pick the US Dollar from the left column and move along the horizontal line to the Japanese Yen, the percentage change displayed in the box will represent USD (base)/JPY (quote).
As of writing, the US Dollar Index (DXY), which gauges the Greenback’s value against six major currencies, is down 0.25% to near 101.24. The DXY is close to its monthly low of 101.10 posted the previous day.
Analysts at ING said Democrats sweep would likely “lead to gridlock on the debt ceiling, a prolonged government shutdown next year”, ING said. The bank further warned that “fears of tougher regulation could weigh on Artificial Intelligence (AI) stocks (we’ve recently seen how that can hit the greenback)”.
On the economic front, investors shift their focus to the US Nonfarm Payrolls (NFP) data for October, which will be released on Friday. The NFP data is expected to have a significant impact on Federal Reserve’s (Fed) monetary policy expectations.
USD/JPY Technical Analysis
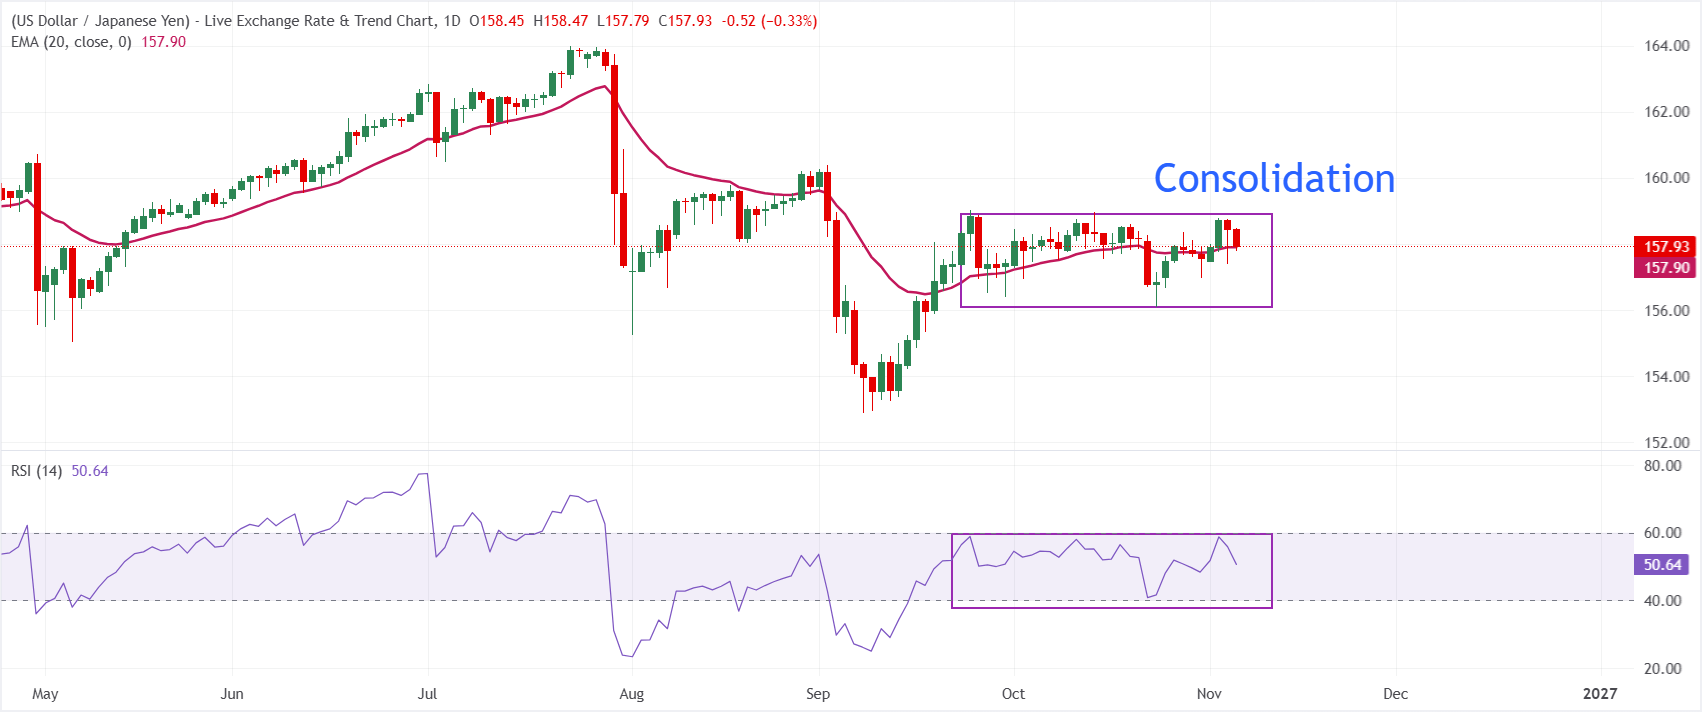
In the daily chart, USD/JPY trades at 157.93. The pair is hovering around the 20-day exponential moving average (EMA) at 157.90, leaving the near-term bias broadly neutral.
The Relative Strength Index (RSI) at 50.66 sits near the midline, hinting at a lack of directional conviction after recent swings, with neither bulls nor bears in clear control for now.
On the downside, initial support is seen at the 20-day EMA near 157.90, a break of which would expose further weakness toward recent lows if selling pressure accelerates. On the topside, with no nearby technical resistance levels from the provided dataset, traders may look to psychological round numbers and prior swing highs beyond the current price as the next areas where upside attempts could start to encounter supply.
(The technical analysis of this story was written with the help of an AI tool. Know more.)
Economic Indicator
Nonfarm Payrolls
The Nonfarm Payrolls release presents the number of new jobs created in the US during the previous month in all non-agricultural businesses; it is released by the US Bureau of Labor Statistics (BLS). The monthly changes in payrolls can be extremely volatile. The number is also subject to strong reviews, which can also trigger volatility in the Forex board. Generally speaking, a high reading is seen as bullish for the US Dollar (USD), while a low reading is seen as bearish, although previous months' reviews and the Unemployment Rate are as relevant as the headline figure. The market's reaction, therefore, depends on how the market assesses all the data contained in the BLS report as a whole.
Read more.Next release: Fri Nov 06, 2026 13:30
Frequency: Monthly
Consensus: 65K
Previous: 29K
Source: US Bureau of Labor Statistics
America’s monthly jobs report is considered the most important economic indicator for forex traders. Released on the first Friday following the reported month, the change in the number of positions is closely correlated with the overall performance of the economy and is monitored by policymakers. Full employment is one of the Federal Reserve’s mandates and it considers developments in the labor market when setting its policies, thus impacting currencies. Despite several leading indicators shaping estimates, Nonfarm Payrolls tend to surprise markets and trigger substantial volatility. Actual figures beating the consensus tend to be USD bullish.
Recommended Articles


